
A COMMISSIONER’S GUIDE TO PROBABILITY
SAMPLING FOR SURVEYS AT USAID
by: Julie Uwimana and Jennifer Kuzara
This document was produced for review by the United States Agency for International Development. It was prepared by Social Solutions
International, Inc. under contract number AID-OAA-M-14-00014.
A Commissioner’s Guide to Probability
Sampling for Surveys at USAID
By: Julie Uwimana and Jennifer Kuzara
Submitted to:
Virginia Lamprecht, Contracting Officer’s Representative (COR)
USAID/Policy, Planning and Learning
Submitted by:
Social Solutions International, Inc.
Contract AID-OAA-M-14-00014
April 24, 2020
DISCLAIMER:
The views expressed in this publication do not necessarily reflect the views of the United States Agency for
International Development or the United States Government.
COVER PHOTO CREDITS:
Left: Unsplash Photo, Ryoji Iwata, 2019
Right: Original Graphic, Jul
ie Uwimana and Jennifer Kuzara, 2020

MECap Knowledge Product
A Commissioner’s Guide to Probability Sampling for Surveys at USAID
By Julie Uwimana and Jennifer Kuzara
This publication was produced at the request of the United States Agency for International Development (USAID). It was prepared under the
Expanding Monitoring and Evaluation Capacities (MECap) task order, contract number AID-OAA-M-14-00014, managed by Social Solutions
International. The views expressed in this publication are solely of the authors and do not reflect the views of USAID.
Contents
Document Purpose and Audience........................... 1
Surveys at USAID ..................................................... 2
Descriptive and Inferential Statistics ...................... 3
Sampling Basics ......................................................... 5
Probabilistic vs. Non-probabilistic ...................................... 5
Probability Sampling ............................................................... 6
How Do I Choose a Sample Frame?........................ 9
Sample Frames and Sampling Bias....................................... 9
Making Generalizations .......................................................10
How Do I Review Sample-Size Calculations? ....... 10
Common Parameters ..........................................................10
Design Effect.......................................................................... 11
Effect Size ...............................................................................12
Statistical Power ...................................................................12
Confidence Level, Margin of Error, and Confidence
Interval ....................................................................................12
Significance and Alpha.......................................................... 13
Non-Response....................................................................... 13
Attrition ..................................................................................13
Other Considerations ............................................. 14
Population Estimates............................................................ 14
Proportional Allocation of the Sample ............................ 15
Sensitivity Analysis................................................................ 16
What Does Sampling Look Like in Practice? ....... 17
Why is My Input in These Decisions Important? . 19
Annex A: Sampling Design Review Checklist....... 22
Annex B: Examples of Statistical Tests for Variable
Combinations .......................................................... 24
Annex C: Sampling Approaches ............................ 27
Annex D: Common Sample Size Parameters...... 28
Annex E: Timeframe............................................... 29
Annex F: Terms....................................................... 31
Resources ................................................................. 33
Document Purpose and Audience
Sampling is the process of studying a subset of a
population for the purposes of describing or
testing questions about a whole population. At
USAID, sampling may be used to collect data for
baselines, evaluations (both impact evaluations and
performance evaluations), assessments that require
survey data, and in some cases in indicator
reporting.
This document includes answers to common
questions that the authors have been asked by
USAID staff and is based on experience, best
practice, and existing agency guidance. Some
USAID bureaus have specific guidance for
population-based surveys, like the
Feed the
Future’s Population Based-Survey Sampling Guide,
which is guidance targeted at practitioners. This
guide reviews similar content at a simplified level
to support commissioners of surveys.
The purpose of this document is to provide a
foundational understanding of probability sampling
to USAID staff to equip them as well-informed
commissioners and consumers of surveys,
evaluations, and other products (hereafter
referred to as studies) that require probability
sampling. We hope that it will serve as a resource
for commissioners to make informed decisions
about surveys and to use monitoring, evaluation,
and learning (MEL) resources effectively. The main
audience for this document includes monitoring, evaluation, and learning specialists, Contracting Officer’s
Repr
esentative (CORs), and Agreement Officer’s Representative (AORs).
This d
ocument is intended to provide a general overview of sampling and r
elated concepts of representative
survey design. It is not official guidance. Rather, it represents good practices in the survey design field. It is
not specific to any USAID initiative or requirement, nor is it exhaustive. When pursuing a representative
April 2020 | 1

A Commissioner’s Guide to Probability Sampling for Surveys at USAID
survey for USAID or in collaboration with other organizations, remember that there are guidelines and
requirements associated with the purpose of the survey, which depends heavily on the stakeholders
involved. The first step to a successful survey is to understand the data needs, existing requirements, and
policies of all stakeholders. As the commissioner, if you are unsure about the information provided by the
external survey team, or the team is unable to answer your questions directly or transparently, seek the
assistance of a survey design expert.
Survey design is a specialized skill set, even among monitoring and evaluation experts. As a commissioner of
a survey, consider the composition of an evaluation or assessment team conducting a survey to ensure the
team has the right mix of skills and equipped to identify potential issues in a survey you are overseeing.
Surveys at USAID
Surveys provide information for decision-making throughout the Program Cycle, answering USAID’s
information needs in annual reporting, assessments, impact evaluations, and performance evaluations.
Surveys can be administered specifically to program participants or the general population of the
communities being served. They can be administered internally by implementing partners as part of their
regular monitoring and evaluation, or they can be administered by USAID or by a party contracted by
USAID specifically for that purpose, such as a monitoring, evaluation, and learning (MEL) platform.
Reporting might include surveys of participants. For example, indicator performance levels are frequently
collected through participant-based surveys and included in annual reports. This kind of survey is typically
administered by implementing partners and reviewed by USAID as part of the regular Data Quality
Assessments conducted on indicator data as required by ADS 201.
Surveys might also be included in assessments. Assessments are forward-looking and may be designed to
examine a country or sector context or to characterize the specific set of problems to be addressed by an
activity, project, or strategy. Assessments may be used to inform strategic planning and both activity and
project design. An assessment is distinct from an evaluation. Assessments, like gender assessments or
household economic analyses (HEAs), are often conducted in advance of or as part of the design process.
Not all assessments use surveys, but when they do, it is because the findings are intended to be
representative of a certain geographic area. Assessments may be used to provide baseline values for key
indicators, and in these cases, it is critical that they represent the intended geographic programming area
and population.
Impact evaluations
usu
ally include surveys to provide quantitative data for an outcome of interest. Impact
evaluations measure the change in a development outcome for program beneficiaries that is attributable to a
defined intervention. Impact evaluations are based on models o f cause and effect and require a credible and
rigorously defined counterfactual to control for factors other than the intervention that might account for
the observed change. In these studies, the measurable change attributed to the intervention is called the
“effect size.” Impact evaluations can have either experimental or quasi-experimental designs. In experimental
designs, conditions are randomly assigned to participants; one condition is the intervention being tested, and
the control group may receive no interventions, or they may receive the current standard of care or some
variant of it. Quasi-experimental designs also use comparison groups, but they are not randomly assigned,
April 2020
| 2

A Commissioner’s Guide to Probability Sampling for Surveys at USAID
which means they require specialized statistical techniques to address the potential for bias in their
comparison groups. These designs include propensity score matching, regression discontinuity, and using
before and after measures from a non-equivalent comparison group.
Surveys are also frequently used in performance evaluations. Performance evaluations encompass a broad
range of evaluation purposes and approaches. They may incorporate before-after comparisons but lack a
rigorously defined counterfactual. More often, performance evaluations provide cross-sectional data (a
snapshot of a single point in time) at mid-term or end-line. When surveys are used in performance
evaluations, it is generally as part of a mixed-methods design, whereby both qualitative and quantitative
measures are utilized in answering the evaluation questions. Surveys of participants are a common feature of
performance evaluations; population-based surveys (those administered among a whole population) are less
common. Because population-based surveys can be more resource-intensive than other approaches to
collecting quantitative data, commissioners of performance evaluations should only elect to use them when
they are appropriate to the evaluation purpose, such as when outcomes need to be measured at the
population level or when interventions are administered at the level of a whole community or catchment
area, making identification of specific beneficiaries impossible.
The specific circumstances of a given survey, as laid out above, will guide the decisions that follow with
respect to sampling, sample size, and the appropriate statistical tests to use, which will also be influenced by
the specific evaluation or study questions underlying the report, assessment, or evaluation.
Descriptive and Inferential Statistics
There are two types of statistics: descriptive and inferential. Descriptive statistics provide a concise
summary of data, numerically or graphically – such as a mean traffic light wait time of four minutes among
those surveyed (or a range of three to five minutes). Inferential statistics use a random sample of data
taken from a population to make inferences or test hypotheses about the whole population. For example,
“the median age of Senegal is 18.4 years old (+/- 2.5 %) based on a sample of 5,000 of its citizens”, or
“Senegalese women who marry after 16 years of age are 6.7 % less likely to experience under-five mortality
in their children (p = 0.038) than women who marry at 16 or younger.”
A study population is needed when using both descriptive and inferential statistics. A study population is
the group of people of which survey questions are being asked. Descriptive statistics only summarize those
from whom data was collected, while inferential statistics require a representative sample of the study
population.
Relying on a sample rather than the overall population may lead to bias. A representative sample is a
sample that reflects the characteristics of a study population and minimizes bias. Random selection does not
ensure that a sample is perfectly representative, but it does help to ensure that any differences between the
sample and the overall population are random rather than systematic. Differences that are systematic can
skew results in a specific direction if the over- or under-represented characteristic is related to an outcome
being measured. There are many types of bias. In this document, bias refers to sampling bias. Sampling bias
results when the traits of the units within the sample frame are different from those in the population that
you are trying to study. In Figure 1, the sample frame (blue) is very similar to the black ring (the target
April 2020 | 3

A Commissioner’s Guide to Probability Sampling for Surveys at USAID
population), but not exactly the same. This is because no sampling frame is ever perfect. The key is knowing
where the sample frame and target population do not align, and if or how it may result in potential bias. For
example, in your study, you may want to draw conclusions about all of the participants in a program, but
you select them based on records that only include the participants who regularly came to meetings. This
sample might include more of the people who had an easier time engaging with the program or who were
more interested in it, and fewer of the people who had a harder time coming to meetings or who were less
engaged.
Figure 1: Population, Sample Frame, and Sample
The central role of inferential statistics is that they can be used to test assumptions or hypotheses about a
parameter (a parameter is defined as either a numerical characteristic of a population, as estimated by a
study variable, or a quantitative variable whose value is chosen for a specific set of circumstance).
Hypothesis tests use statistical analysis to compare a hypothesis that there was an effect (or difference,
relationship, change, etc.) with the “null hypothesis” or default assumption of no effect (or difference,
relationship, change, etc.). In evaluation, the hypotheses being compared are usually that the intervention
had an effect versus the null hypothesis that it did not. When the finding is significant, it means that the
intervention probably had an effect. A result that is not significant means you cannot reject the null
hypothesis that the intervention had no effect.
Study questions often pertain to the relationship between characteristics or aspects of an experience. In
evaluations, this is most often of interest to study the relationship between an intervention and an outcome.
The outcome is called the “dependent variable” because it responds to (is dependent on) the intervention
(e.g., reading skills). In such relationships, the effects of factors other than the intervention that may also
affect the outcome of interest are accounted for, in order to isolate the effect of the intervention. The other
factors, called control variables, together with exposure to the intervention, are known as “independent
variables” (e.g., student age). In addition to establishing relationships, a study may further test these
relationships. The kind of test that is most appropriate for a given situation depends on the nature of the
variables, for example, whether they are numerical variables like height or nominal variables like marital
status.
April 2020 | 4

A Commissioner’s Guide to Probability Sampling for Surveys at USAID
It is essential to know whether descriptive or inferential statistics are planned for your study because it
influences the types of survey data that is needed and the type of statistical tests that can be conducted. To
better understand the options for statistical tests, refer to Annex B: Examples of Statistical Tests for
Variable Combinations.
Descriptive and Inferential Statistics
Questions to ask yourself:
What is y
our study population? What population do you
want to be able to test hypotheses about, make
statements about, and generalize findings to?
Knowing your study population will help the
survey team identify a sound sampling frame.
Questions to ask your survey team:
What kinds of statistics are you planning to use? Are you
planning to test relationships? Do you intend to make
claims about a whole population? Are you only interested
in describing the people you have surveyed?
The type of questions you are interested in
dictate the statistical tests
you may use.
Sampling Basics
Perfect measurement of a characteristic is rarely, if ever, practical, which is why we use sampling to
approximate the (unknowable) true value within a certain tolerance for precision.
Statistical error is the unknown difference between an estimated value from a sample and the “true”
value based on the whole population. In the most basic sense, it is noise in the data resulting from random
chance. A true value is a value that would result from ideal measurement.
For example, if you could locate and collect a perfectly precise measure of the height of every single
American adult and then calculate sex-disaggregated means, you would have “true” values for the average
height of American men and women.
There are many methods of approximating a true value through sampling. The following section
provides a foundational overview of approaches.
Probabilistic vs. Non-probabilistic
There are two main types of sampling approaches: probabilistic and non-probabilistic. In a probabilistic
sampling, every sampling unit (e.g., person or household or school) within the sample frame has some
probability of being selected. A sample frame is a group of units from which a subset is drawn (e.g., all
beneficiaries of a program or all schools covered by an intervention or all schools in a country). The sample
frame defines the units eligible to be sampled but does not imply that each unit within the sample frame will
be selected for data collection. Recall that the study population is the group of people of which survey
questions are being asked. More explicitly, the study population are the units that the sample is expected to
represent. If random selection is performed by choosing tickets out of a hat, the sample frame is all the
tickets in the hat.
Probabilistic methods are used when it is important to ensure that the sampling units selected represent the
larger population. A representative sample is achieved through probabilistic sampling approaches. This form
April 2020 | 5

A Commissioner’s Guide to Probability Sampling for Surveys at USAID
of sampling minimizes the potential for sampling bias resulting from the over- or under-representation of
people in the final sample relative to the population, because of the way sampling was designed. The
objective in developing a good sample frame is to make the probability of being selected as equal as possible
among the units of the study population, given the constraints of the sampling approach. However, the
probability of being selected for a sample will never be exactly equivalent for all units in the study
population. This is because sample frames are imperfect.
Non-probabilistic meth
ods use purposeful selection and judgment factors to choose sampling units. Non-
probabilistic methods are used when studying a specific issue, event, or group of people who does not need
to be representative (e.g., collecting data from success stories). Non-probabilistic sampling designs limit the
kind of statistical analyses that can be done on resulting data. In general, descriptive statistics (which should
not be generalized beyond the sample) are best suited to non-probabilistic samples. Inferential statistics are
frequently inappropriate for these designs.
1
A convenience sample is one example of non-probabilistic
sampling when selection is based on convenience of contact. For example, the findings from a convenience
sample to determine the median age of women visiting a specific village clinic should not be used to
extrapolate the age of women nationally visiting clinics.
An exc
eption to this rule is known as a census, which is when you are able to get information from all or
nearly all members of the population to which you want to generalize. This is not considered sampling
because you are not selecting a part to represent the whole. Rather, you are trying to capture the whole
directly. There is no probability involved (because there is no sampling), but you are able to conduct
statistical analyses. If you interview every student enrolled in a given school, you have a census for it, and any
claims you make will be accurate for that school (though not for others).
Probability Sampling
As mentioned above, probabilistic or probability sampling is a selection method whereby every sampling unit
within the sample frame has a specific probability of being selected, and that probability can be estimated.
There are five types of probability sampling: simple random, systematic random sampling, stratified, multi-
stage, and cluster. This section briefly explains each type. It is possible to have multiple sampling approaches
present in one design.
Simple Random Sampling
Simple random sampling is an approach where every unit in the sample frame has roughly the same probability
of being selected. An example of simple random sampling is randomly selecting beneficiaries from a
complete beneficiary list. In this case, the sample frame is the complete beneficiary list. Because all of the
sampling units or beneficiaries are known, each has an equal probability of being selected. Simple random
sampling is most common in scenarios where the sample frame is small and defined. The larger the sample
frame, the more difficult and costly it is to use simple random sampling.
Systematic Random Sampling
In systematic random sampling, sampling units are selected according to a random starting point and a fixed,
periodic interval. Selection begins with an ordered or randomized list, and every r-th sampling unit are
1
In some cases, a specialized parameter might be appropriate (for example, if snowball sampling is used for a social network analysis, specialized
statistics can be used that are not dependent on the representativeness of the sample), but this needs to be determined on a case-by-case basis.
April 2020 | 6

A Commissioner’s Guide to Probability Sampling for Surveys at USAID
selected. In the beneficiary list example, systematic random sampling of beneficiaries in a defined list would
be accomplished by either using a spreadsheet or statistical program function to randomize the list and then
selecting every fifth beneficiary in the list, for example. The interval is usually selected based on the
proportion of the list that will be sampled. If there are 1,000 beneficiaries, and 250 of them are to be
sampled, you would randomly order the list and then select every fourth person.
Stratified Sampling
Stratified sampling splits an entire population into homogeneous groups or strata before sampling. The
sample is then selected randomly from each stratum. Examples of strata are geographic regions, age groups,
grades, or any other classification which: 1) includes the entire population of interest (collectively
exhaustive); and 2) defines categories so that each sampling unit is only assigned to one stratum, (mutually
exclusive).
Stratified sampling is most commonly used in the following cases: 1) y
our outcome variable is strongly
related to your stratification variable; in these cases, stratification reduces error; 2) to ensure that you can
conduct sub-population analyses, either because you guarantee having the minimum sample size allowed
through normal stratification or because you have introduced oversampling into your stratification
scheme; and 3) in cases where your sample frame already stratifies in some way - so stratification is just
easier.
2
Oversampling is a special type of stratified sampling in which disproportional numbers of sampling units
are selected from specific strata. This is designed to ensure that there are enough members of a particular
group displaying a specific, usually low-prevalence, characteristic to conduct sub-analyses on that group. For
example, USAID is often interested in the well-being of marginalized populations, which are usually in the
minority of a population. To conduct analyses at this level, more minority individuals need to be included in
the overall sample size than the proportion of the population they actually represent, effectively increasing
the sub-sample of the marginalized group.
3
Multistage Sampling
Multi-stage sampling starts with the primary sampling unit (PSU), or the units selected in the first stage
of a multi-stage sampling design. It divides the population into smaller and smaller configurations before
sampling. The sample is drawn from the smallest unit of analysis. Multi-stage sampling is often preferred for
its functionality and cost-effectiveness compared to simple random sampling. Multistage sampling will
commonly use multiple approaches to sampling within the various stages.
For example, if you want to randomly select individuals from a household beneficiary list, but you only need
one respondent per household, you may start by randomly selecting households from the list (first stage),
then ask the members of the household to give you a complete list of household members who meet the
2
This is potentially problematic and is often used incorrectly in cluster sampling, e.g., "we pre-selected this district purposively and then took 26% of
our sample from there because they have 26% of the total population," when actually a PPS approach is what is needed to choose the district.
3
Note that oversampling is done to facilitate the analysis of specific sub-populations. For analyses of the overall population, any over-sampling that
was done will need to be accounted for through weighting to ensure that the minority population is not over-represented in point estimates for the
larger population.
April 2020 | 7

A Commissioner’s Guide to Probability Sampling for Surveys at USAID
inclusion criteria (e.g., women in reproductive age, elderly visiting health clinics, working men), and choose
randomly from that list (second stage).
Cluster Sampling
A cluster sample is a special kind of multistage sample.
4
In cluster sampling, you divide the population into
clusters, select a subset of those clusters, and then select a sample from within each of the selected clusters.
A cluster is the smallest area unit selected for a survey. An example of a multistage cluster sample is
choosing 20 schools randomly from a list of 300 schools, and then selecting 40 students from each selected
school from a total sample of 800 students. An enumeration area is a special kind of cluster and the
result of having a census. Enumeration areas (EAs) are small geographic units specifically designed for census
data collection and often designed to be equal in size.
Clusters may be selected randomly or purposively, and the selection of the sample within the individual
cluster is generally probabilistic. When clusters are selected probabilistically, so long as the right weighting is
applied at selection and analysis, generalizability is feasible. However, it is important to remember that when
choosing clusters purposively, findings should not be extrapolated more broadly than that specific cluster.
For example, if an intervention is designed to improve the health status of women in a rural district in the
northeast of a country, findings from that sample should not be ascribed to the entire region, only the
specific district purposively selected for the cluster. Similarly, when an entire region is probabilistically
sampled, the findings from that sample would be representative of the whole region, not only the selected
clusters.
The approach to sampling will vary based on the design and the sample frames, but systematic and stratified
ap
proaches are both common. In cluster sampling, it is assumed that clusters are naturally defined (e.g.,
households, schools, clinics, counties) so that the sampling units within are similar in nature (e.g., the
individuals within a cluster share many characteristics). Otherwise, sub-populations may be over- or under-
represented, depending on which clusters are selected. Later, we will discuss strategies survey designers use
to address this challenge.
4
Not all multistage samples are cluster samples, but all cluster samples are selected in stages.
April 2020 | 8

A Commissioner’s Guide to Probability Sampling for Surveys at USAID
Sampling Basics
Questions to ask yourself:
What is the primary use of the findings from
this study? Have you communicated them
with the survey team?
Understa
nding the intended use of the findings will better
equip the survey team to create a strong sampling design.
Are any of
your study questions designed to
result in quantitative findings about a
subpopulation that is 10 percent or less of
the total population?
If so, the s
urvey design might need oversampling. Consult
with the des
ign team to decide whether oversampling is
necessary. **Recall that oversampling
is
a special type of
stratified sampling that intentionally includes more sampling
units into the sample size than would be included through a
randomized sa
mple. This is designed to
ensure that there
are enough
members of a particular group
displaying a
specific, usually low-prevalence, characteristic to conduct
sub-analyses
on that group.
5
Question to ask your survey team:
Is your survey team planning on making
claims about an entire population based on a
sample?
If so, conf
irm that they are also using a probabilistic
sampling
method. The most common probabilistic design
used at USAID is a multi-stage cluster design, in which case
confirm that each stage of sampling is clearly defined.
How Do I Choose a Sample Frame?
Sample Frames and Sampling Bias
Recall that a sample frame is a group of units from which a sample is drawn; it will be roughly but not
exactly the same as the group of units that the sample is expected to represent, the study population. It
defines the units eligible to be sampled. In multi-stage sampling, each stage has a defined sample frame or a
selection rule (remember that in multi-stage designs, some stages may be probabilistic while others are not).
A sample frame can include households within a political-administrative division, like a county or region, or a
list of identifications for people in a specific area, like a local registry or a program participant list. In each
case, the sample frame has the potential to introduce sampling bias because the sample frame may differ in
small or large ways from the intended study population.
A sampling bias occurs when the traits of the units within the sample frame (e.g., spotty list of program
participants or records on the participants who are most interested in the services and come more regularly
to meetings) are different from those in the population that you are trying to study (e.g., all program
participants). The differences may be slight, based on a trend in behavior, or more extreme, for example,
when the choice of sample frame has the effect of entirely excluding a specific sub-group of the population
from the sample frame. For example, if all the people who own a cell phone in a specified town are used as a
sample frame to randomly select community members for a community-based public health survey, then
those without phones would be systematically excluded. This is not to say that using the telephone numbers
as a sample frame is wrong. However, excluding those who do not own a phone may introduce bias (Are
they older? Less wealthy? Less comfortable with technology?) and should be addressed in the clarification of
the study limitations and in the interpretation of its results.
5
Kish, L.: Survey Sampling. John Wiley & Sons, Inc., New York, London 1965, IX + 643 S., 31 Abb., 56 Tab., Preis 83 s.
April 2020 | 9

A Commissioner’s Guide to Probability Sampling for Surveys at USAID
Sampling limitations are often addressed in specific sections of both survey design proposals and survey
reports. What qualifies as a limitation depends uniquely on each survey design and its associated questions.
A limitation can be any significant weakness in the design by which the findings could be influenced. In the
example given above, a limitation might be that cell phone ownership is correlated with socioeconomic
status, and therefore the poorest people in the study population are systematically under-represented.
How Do I Choose a Sample Frame?
Question to ask yourself:
Who are the people your study questions are asking
about, and how well does the sample frame matches
that study population?
Knowing the primary subject of your study
questions will help determine an appropriate sample
frame.
Question to ask your survey team:
What is the sample frame for each stage of
sampling?
Most population-based surveys at USAID are multi-
stage, cluster designs. The survey team should be
clear about how selection is approached at each
stage.
How is the sample frame being constructed? What
are its limitations in generalizing to the study
population?
Most sample frames in population surveys are
proxies for the total population, and each choice of
frame will come with limitations.
Making Generalizations
Sample frames are important. They sometimes limit the extent to which the findings of a study can be
generalized. This is a separate issue from the issue of sampling bias; it refers to the ability to make inferences
about the overall study population on the basis of a sample. Almost all samples have some degree of bias;
but too much bias can impede the ability of researchers to apply findings from within the sample to findings
outside the sample. In the same cell phone example, the sample frame is imperfect, but results can be
inferred to represent the whole community, albeit with some degree of bias. Findings based on this sample
would not be appropriate to generalize outside the community from which the cell phone registry was taken,
because the sample frame was only selected to represent that one community.
How Do I Review Sample-Size Calculations?
This section gives a basic overview of common parameters and
considerations involved in calculating a sample size. Parameters are
values that need to be set to complete a sample size calculation. It also
provides a checklist for reviewing sample size calculations.
Common Parameters
Sample size is the number of respondents needed to estimate the
statistics of the population of interest with sufficient precision for the
inferences you want to make. Different formulas are used to estimate
the necessary sample size depending on the sampling methodology and
the type of analysis planned. However, all formulas use a common set of
parameters. Recall that parameters are values that need to be set to
complete a sample size calculation.
Sample Size Formulas:
The
formula used to calculate sample size
depends in part on the nature of the
desired statistical test,
which, in turn,
is partly determined by the nature of
the variables being measured.
Annex B
of this document provides
a quick guide to the most common
inferential statistical tests that are
used for different combinations of
variables.
April 2020 | 10

A Commissioner’s Guide to Probability Sampling for Surveys at USAID
This section explains the most common parameters used in sample size calculations: design effect, effect
size, statistical power, confidence level, margin of error, significance, non-response, and attrition. For an
example of a sample size calculator, refer to USAID’s Feed the Future Sample Size Calculator.
Design Effect
For a cluster design or other multi-stage design, it is necessary to factor in a design effect (DEFF) in the
sample size calculation. The design effect is an additional error that is introduced by the sampling design.
Multi-stage designs have less precision and greater potential for error than simple random sampling. DEFF is
the difference between the error the survey has because of its design, and the error it would have had
under a simple random sample.
The DEFF makes
the adjustment needed to find the survey sample size when using sampling methods
different from simple random sample. Effective sample size is equal to the actual sample size divided by
DEFF.
Actual DEFF ca
n only be calculated after data
have been collected and analyzed for variance,
but design effects can also be estimated before
data collection to more accurately estimate the
sample size needed in complex designs. For
example, to calculate sample size in a cluster
design, a survey team needs to know the
number of clusters that will be sampled and the
size of each cluster. This will ultimately be used
to calculate an intraclass correlation coefficient
(ICC), which is necessary to calculate DEFF
after all data have been collected. The ICC
measures the amount of total variation in an
outcome that can be attributed to differences
between clusters. It uses measures of variation
within clusters and variation between clusters.
Predicting what this coefficient will be is the
most challenging part of estimating DEFF. If
there are no existing data (from other surveys
in the area, for example), then a range of values
should be tested to see how the effective
sample size changes in response to different
possible DEFFs. The higher the intraclass
correlation coefficient, the larger the sample
size needed.
Table 1: Sample Size and Design Effect
Examples of sample size calculations for three common Margin of errors: M1 =
.05; M2 = .07; M3 = .10.
A. Sample Size Calculation: Design Effect 2.0
M1
M2
M3
Estimated Proportion
0.500
0.500
0.500
Alpha
0.050
0.050
0.050
Confidence Level
0.975
0.975
0.975
Margin of Error
0.050
0.070
0.100
Design Effect
2.0
2.0
2.0
Initial Sample Size 769 392 193
Plus 5% N on-response 807 412 203
B. S
ample Size Calculation: Desig
n Effect 4.0
M1
M2
M3
Estimated Proportion
0.500
0.500
0.500
Alpha
0.050
0.050
0.050
Confidence Level
0.975
0.975
0.975
Margin of Error
0.050
0.070
0.100
Design Effect
4.0
4.0
4.0
Initial Sample Size
1,537
784
385
5% Non-response
1,614
823
40
The two examples above show how the design effect and margin of error
influence the sample size needed to be able to accurately estimate the
proportion of a variable in a population. The more precision desired, as
illustrated by the smaller margin of error, the larger a sample size needed.
Similarly, the larger the design effect or possible error introduced by the
sampling design, the larger the sample size needed.
DEFFs are always ≥1, where 1 represents
simple random sampling, and therefore, there is
April 2020 | 11
A Commissioner’s Guide to Probability Sampling for Surveys at USAID
no design effect. The higher the design effect, the smaller the effective sample size. A DEFF of 1.5 means that
the actual sample needs to be 150 percent higher than what it would be if there was no design effect. Refer
to Table 1. Note that with the exact same parameters, only different DEFF’s, the first example uses a DEFF
of 2 and the second 4- doubling the sample size.
Scenarios that would increase DEFF include when clusters are few and large or when clusters are very
different from one another, or the number of PSU’s per cluster is high. When existing DEFF data are not
possible to find, a common DEFF is 2. A DEFF can be naturally lowered by sampling from a larger number of
smaller clusters, rather than only a few larger clusters, to achieve a comparable sample size. The larger or
fewer clusters being sampled from, the greater the potential for over-representing the traits of that cluster
in the total sample.
Effect Size
The effect size is the strength or magnitude of the difference between the sets of data. Often, the sets of
data represent before and after values for a group that received an intervention and for a control or
comparison group, to measure the size of the difference in the effect of that intervention relative to the
control. The smaller the effect size, the larger the sample required to detect it. Effect sizes are seen in
impact evaluations more often than performance evaluations.
The formula used to calculate sample size depends on the specific hypothesis test planned for the data.
Sample sizes should be calculated for all outcomes to be measured, and the largest (most conservative) of
the sample sizes used. Often, survey teams will measure more than one outcome, and in these cases, they
should use the outcome with the smallest estimated effect size for their sample size calculation (which will
require the largest sample size to detect). A review of background literature can provide a sense of what the
effect sizes might be. It is often wise to calculate sample sizes from a few different effect sizes within a range
(e.g., five percent, ten percent, and 20 percent). This is called a sensitivity analysis.
Remember that the effect size you use to calculate sample size is an estimate of the effect size you want to
achieve (your target). Use the estimate that is the minimum you wish to be able to detect.
Statistical Power
Statistical power, used for inferential statistics, is the probability that if a real effect exists (for example, the
difference between the two groups before and after an intervention), the sample selected will be sufficient
to detect it. To calculate a sample size for inferential analysis, the survey team will need to decide on a
statistical power. The higher the power, the more likely the study will detect an effect, but it also requires a
larger sample. The value for this parameter most often used in social sciences is .80.
Confidence Level, Margin of Error, and Confidence Interval
Methods to calculate sample size require you to decide on a confidence level and a margin of error. The
confidence level is one measure of the validity of your results, and the margin of error is a measure of
their precision. The more precision you want (i.e. the smaller the margin of error), the larger the sample
size you will need. Likewise, the higher the level of confidence you want to have in the validity of your
results, the larger the sample size you will need.
April 2020 | 12
A Commissioner’s Guide to Probability Sampling for Surveys at USAID
When calculating a value from data, such as a point estimate or an effect size, statistical techniques are used
to determine a range within which the “real” value is likely to fall, with a specified level of confidence. If the
confidence level is 95 percent, for example, then if a study could be repeated 100 times, in 95 of them the
identified range of values would include the “real” value. The higher the level of confidence you want to have
in your result, the larger the sample size needed. Commonly used confidence levels are 90 percent, 95
percent, and 99 percent, but 95 percent is the most common.
The margin of error refers to the amount of error due to random factors you wish to allow in your results;
in other words, it determines the amount of precision you will have for your result. Survey teams choose a
specific margin of error they want to aim for. Increasing the sample size reduces the amount of error, so
reducing the margin of error requires increasing the sample size.
The margin of error is related to the confidence interval; it is half the width of the confidence interval. The
confidence interval is the range within which your result falls, at your desired confidence level. You might
see a confidence interval expressed as: “Mean = 15.6 (CI 14.8; 16.40)” or “Mean = 15.6 ± 0.8.”
Significance and Alpha
Significance is a feature of the results of hypothesis tests. A finding is called statistically significant when
there is a low probability that it is due to chance alone. When a statistic is significant, it simply means that
the survey team is very sure that the finding is real and not due to chance. It doesn't definitively mean the
finding is valuable or that it has specific decision-making utility. Significance is related to confidence level and
Alpha. At a confidence level of 95 percent, a significant result is one the survey team can be 95 percent sure
is due to an actual difference between the samples and not to random chance. On the other hand, Alpha is
the probability of rejecting the null hypothesis when the null hypothesis is true or the probability of being
incorrect. Therefore, if the confidence level is 95 percent, Alpha is 0.05.
Non-Response
When calculating sample size, include a factor of non-response. This means accounting for selected
respondents who will choose not to participate or not to answer questions about the outcomes you wish to
measure, effectively adding to the needed sample size. The estimated percentage of non-response can be
drawn from comparable studies in similar locations. A common non-response rate estimate for sample size
calculation is 5-10 percent.
Attrition
Attrition is particularly relevant for longitudinal studies (studies that takes place over a pre-determined time
period, using repeated observations of the same subjects). Selected respondents at the beginning of a study
may move or decline to participate before it has been completed. In these cases, attrition may also be
accounted for but is distinct from non-response.
Attrition and non-respo
nse may each introduce bias into your findings, particularly if certain kinds of people
are more likely to drop out because of their characteristics. For example, younger and lower-income people
are more likely to move and may move away from the study area at higher rates than other people. If the
outcome is related to age or wealth, then the loss of these individuals may result in over- or under-
estimating the outcome.
April 2020
| 13

A Commissioner’s Guide to Probability Sampling for Surveys at USAID
Attrition as a limitation should be acknowledged by survey teams, mitigated where possible by weighting the
data in the analysis stage to account for missing data, and considered in the interpretation or generalization
of findings.
How Do I Review Sample-Size Calculations?
Question to ask yourself:
How much precision do you need around a
point estimate? This means, in order for the
findings to be useful for the purpose of the
intended audience, how close do you need to
be to the measurement of interest if it were
to be measured perfectly?
Not all measurement purposes require high precision. For
exam
ple, measuring the average number of children per
family for the purpose of describing national demographics
might require less precision than knowing how many
children in a specific district are undernourished and
therefore intended targets of a nutrition intervention.
Recall that higher precision requires larger samples sizes.
Higher sample sizes require larger budgets. Therefore, it is
prudent to understand the degree to which your
measurements need to be precise.
Question to ask your survey team:
What parameters are being used to calculate
sample size, and how were they selected?
Your s
urvey team should be able to justify the parameters
they have selected, including those based upon common
practice, and those based on reasonable, data-driven
estimates. Review the estimates, especially for parameters
relating to your outcomes, to be sure they match your
expectations and the degree of precision needed. See
Annex D for Common Sample Size Parameters
Other Considerations
Population Estimates
Population data are required for sample size calculations for a representative survey, as well as for
probability-proportional-to-size selections. In scenarios where quality census data exist, population data can
be provided at the enumeration area level. As previously mentioned, enumeration areas (EAs) are small
geographic units specifically designed for census data collection and often designed to be equal in size,
making sampling from them much more straightforward. To be clear, an EA is not a generic term and is only
the direct result of having a census.
If there are no quality census data, as in countries with failures of governance or a history of conflict, and
widespread population movements, designers of a sampling frame will need to compensate by including an
alternative for population estimates that sufficiently representative of the population being studied if they
wish for their survey to be representative at the population level. In most cases where EAs are available,
they are likely to be preferred for use as clusters, because they have already defined geographic boundaries
and associated population data.
April 2020 | 14

A Commissioner’s Guide to Probability Sampling for Surveys at USAID
Proportional Allocation of the Sample
In cluster designs (and some other cases where people are selected in groups, as when sampling schools or
the catchment area of a clinic or service provider), there is a risk of over- or under-representing specific
characteristics or traits in the results, because they are more or less prevalent in that cluster or group than
in the total population. This can be particularly important when there are differences in characteristics
between rural and urban populations.
Consider a situation in which ten towns
are eligible for selection, and the population of the towns’ ranges
from 542 at the low end to 251,724 at the high end, with a total population across the ten of 588,766. If a
simple random sample is used to select towns, each with a one-in-ten chance of being selected, then the 542
people in the smallest town will have a one-in-ten chance of selection even while making up <1 percent of
the total population. The characteristics of residents of that town will be over-represented relative to the
total population. This can be addressed through weighting at analysis (in which analysts “count” some
respondents less than others by specific percentages), but another popular approach is to use probability-
proportional-to-size (PPS) selection.
In PPS s
ampling approaches, random selection is still used, but a cluster is assigned a probability of selection
that is equal to the proportion of the overall population made up by the residents of that cluster. In our
example from above, the smallest town would have 542 chances out of 588,766 of being selected (that is, if
tickets were being drawn from a hat to select the town, it would have 542 tickets in the hat, while the
largest town would have 251,724 tickets, and so on).
Usually, PPS sampling is achieved using a sta
tistical software program, which requires reasonably reliable
population estimates for each cluster. This could be a list of towns within a geographic area, but it may also
be a list of EAs or some other geographic unit. In either case, the population estimates used for PPS
sampling should be confirmed by survey teams on the ground. This is usually accomplished by conferring
with local officials when they arrive in town. The updated population estimates will be used to apply a
weight at the analysis stage to correct for any errors in the estimates used and to ensure that the resulting
statistics are as representative as possible.
6
In most countries, relatively current pop
ulation estimates are readily available, but in some countries where
USAID works, particularly those affected by disruptions to governance or on-going conflict, population data
may be unavailable or too outdated to use, complicating the use of PPS. In such cases, it is recommended
that survey commissioners or implementers consult with implementing partners, other donors, and UN
agencies operating in the area, who may have collected population data from towns in which they work. In
cases where population estimates are suspected to be of low quality, they may still be used for PPS selection
of clusters, but surveyors should confirm population figures for clusters they visit; usually, this information
can be obtained from local authorities. If estimates are found to be substantially different from those used
for PPS selection, weighting can be applied at analysis to correct for this difference. Such a practice can be
beneficial, even when surveyors are reasonably confident in the estimates used for PPS, but is essential when
6
An alternative to PPS is to define clusters so that they have equal sub-populations, and then the clusters can be selected with a simple, unweighted,
random sample. This is the practice behind EAs, which are often determined so as to have a common range of households and equal sub-
populations.
April 2020 | 15

A Commissioner’s Guide to Probability Sampling for Surveys at USAID
data are suspect. See Box 1 for some alternative sources of population data when census data are not
available.
Box 1: Population Data Sources: Census data is the most straightforward way of estimating population size.
However, not every country where USAID works has an up-to-date, quality census. Census data that are old can still
be used in many cases, but not if: 1) they are very old (if a census has not been done in several decades, for example),
or 2) there have been large-scale population movements due to conflict, natural disaster, or urban migration since the
time of the last census. And in some rare cases, there is simply no census at all. Alternative approaches to identifying
population data for use in PPS sampling include:
• Tapping into implementing partner (IP) population estimates. IP’s usually keep up-to-date population counts
for the areas in which they work, or have relationships with local authorities who can provide the data.
• Examining whether there are any USG-supported surveys occurring in the country. The US government
supports a wide range of studies in different sectors (for example, the Demographic and Health Surveys and
various rounds and regions of the global barometer surveys). If a representative survey is being conducted,
you can inquire about the source of the population data they are using.
• Reaching out to UN agencies operating in-country. The United Nations Population Fund (UNFPA) and other
UN organizations sometimes conduct population estimation exercises when there is no available census data.
If conflict has caused population movements, the International Organization for Migration (IOM) may have
data to share.
• Check the availability of estimates derived from satellite imagery, such as LandScan from the Oakridge
National Laboratory, which is free to USG. LandScan is developed using best available demographic (Census)
and geographic data and remote-sensing imagery analysis techniques to disaggregate and impute census counts
to small geographic units within any given administrative boundary.
Other Considerations
Questions to ask yourself:
Did the survey team include a design effect, and if
not, do they have a good reason for not including
it?
In simple random sampling, which is often possible
within beneficiary groups, there is no additional
error introduced with design. However, with any
multistage cluster design, there should be a listed
DEFF within the design document.
Questions to ask your survey team:
How was the DEFF determined?
If a survey design estimates too low a DEFF as a
way of keeping sample size and costs low, it risks
resulting in an underpowered survey. All multistage
surveys should include a design effect that is > 1,
and if there is no design effect included in the
sample size calculations or the design effect = 1,
you should be asking your survey team why.
Sensitivity Analysis
When various sampling designs are being considered, survey teams may conduct a sensitivity analysis to
determine reasonable levels for effect size and design effect. Recall that effect size and design effect, as used
in a sample size calculation, are (ideally) based on existing, comparable studies or based on knowledge of the
field, and the estimates are ultimately chosen by the survey team. The design effect can only be estimated at
this stage and is not definitively calculated until the data analysis stage. Effect size is an estimation of change
to be detected. Therefore, the effect size and design effect used in the sample size calculations are informed
estimations for empirical parameters that will be calculated later. To conduct a sensitivity analysis, survey
April 2020 | 16

A Commissioner’s Guide to Probability Sampling for Surveys at USAID
teams first review comparable studies to note the DEFF and effect size. The effect size estimated by other
studies can suggest a reasonable effect to assume, given a particular sector or study purpose. Existing studies
with similar sampling designs in the location of interest will also provide insight into what one can expect the
DEFF to be at the analysis stage. Second, the survey team would use estimated values for the DEFF and
effect size, based on these resources, to run sample size calculations at different DEFF and effect size levels,
using different sampling designs (e.g., number of clusters). Ultimately, survey teams choose one of the sets of
parameters (and the associated sample size) as the one that best meets their (sometimes competing) needs.
By having done sensitivity testing, survey teams can have more confidence in the DEFF and effect size
estimations selected as they relate to the purpose of the survey and existing limitations, like time frame and
budget.
What Does Sampling Look Like in Practice?
This section gives a basic overview of sampling stages in a cluster design using enumeration areas (EAs) and
without EAs. When EAs are available, they should be used. If EAs are not available, aspects of the
environment will determine your options, including whether there are independent population estimates
available (see Box 1 for sources).
Sampling with EAs
Prior to sampling, survey teams should know the geographic boundaries they wish to focus on. These
boundaries will determine the sample frame for the initial stage of sampling. Geographic boundaries are
typically at the district, regional, or country level.
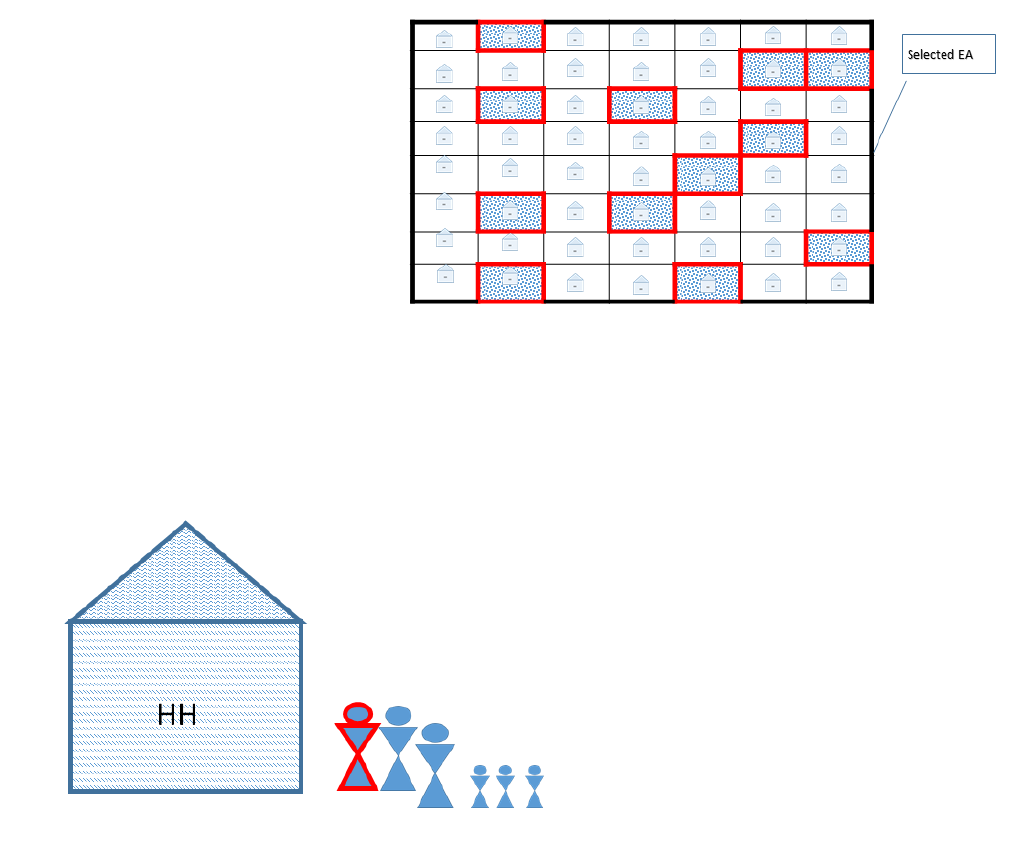
Figure 2: Randomly Selected EAs within the Sample Frame
Stage 1: Selection of EAs (these will be
the PSU). Once the sample frame is set, the
sample EAs can be selected. Because lists of
EAs are sometimes available (often with
number IDs, along with population sizes and
GPS coordinates), EAs can be selected
through either simple or systematic random
sampling. They may also be selected using a
PPS approach, particularly if they vary
considerably in their population size. In either
case, data should be weighted at analysis to
account for population size. As an illustration,
in Figure 2, the ce
lls in red represent the selected EA’s from the sample frame. Note, some EA’s are inside the
sample frame, but not selected for data collection.
April 2020 | 17
A Commissioner’s Guide to Probability Sampling for Surveys at USAID
Figure 3: Randomly Selected Households within the Selected EA
Stage 2: Selection of HH. If household
numbers are available within EAs, then
HHs can be selected randomly from an
existing list (see Figure 3). If household
numbers are not available, a household
list can be constructed manually, usually
by consulting with local authorities and
completing a community map. An
alternative approach to household
selection is a transect walk. In a transect
walk, each member of the survey team
starts from a specific point within an
enumeration area an
d walks in a randomly selected direction, interviewing every n-th household. If transect
walks are used, the rules for selection should be clearly specified and consistent across all EAs in the survey.
While not strictly a probabilistic approach to household selection, this kind of approach is commonly used
wherever it is impractical for a survey team to list households.
Figure 4: Household Respondent Selection
Stage 3: Ru
les for selection of HH
members. Once a household is selected,
HH members may be selected according
to pre-identified selection criteria, or else
randomly (the person outlined in red in
Figure 4). Some surveys are designed to
include all eligible household members in
the survey; more commonly, a specific
type of respondent is desired (e.g.,
household heads, women who gave birth
in the last six months, or adults between
the ages of 18 and 65). If only one
respondent is desired per household, and
that person has not been pre-identified
by role, enumerators should list all eligible household members (if there are more than one), and select
randomly among them using a random number chart. Survey designs should be clear and specific about how
household members will be selected.
To summa
rize, the proceeding sampling steps, the household in Figure 4 was inside the sample frame and
geographically located within one of the selected EAs within the sample frame. Among all of the households
in the selected EA in which this household live, it was again selected to be part of the data collection. Once
the household was selected, a rule was applied whereby only one person, the one highlighted in red in
Figure 4, was selected to respond for that household.
April 2020 | 18

A Commissioner’s Guide to Probability Sampling for Surveys at USAID
Sampling without EAs
Sampling without EAs is different than sampling with EAs - but only in the first stage of sampling. When EAs
are not available for an area, survey teams will usually use a locally relevant administrative unit instead – like
a county or village. It is essential that the unit be locally relevant because survey teams will likely depend on
local authorities for confirmation of population estimates. The choice of administrative units will depend on
a number of factors, including availability of population estimates, logistical constraints, and the number of
clusters to be visited.
What Does Sampling Look Like in Practice?
Question to ask your survey team:
Does your country have EAs? If so, what
year was the census? Have there been large
population movements since the census was
conducted?
When quality EAs are available, they are the best option.
However, if large population movements took place after
the census or data quality is questionable, the data may not
be usable as a reference for population data. Recall that EAs
are small geographic units specifically designed for census
data collection and often designed to be equal in size, making
sampling from them much more straightforward. To be
clear, an EA is not a generic term and is only the direct
result of having a census.
Questions to ask your survey team:
If using PPS, what approach does the survey
team intend to take to confirm estimates
used in PPS allocation in the field?
The population estimates used to calculate the sample size
should be confirmed in the field. The data is then weighted
based on the confirmed population numbers, not the
estimated numbers used to calculate sample size. Weighting
means counting a respondent’s value as slightly more or less
than one, based on the portion of the population their
cluster represents. This is done because the population
numbers gathered during data collection will always be the
most recent compared to other available data.
Why is My Input in These Decisions Important?
Survey design teams will make dozens of decisions over the course of a survey design. In most cases, these
decisions do not necessarily have a right or wrong answer but do entail a set of trade-offs with respect to
your study questions and how you will be able to interpret findings. The intended utilization of the data will
inform which trade-offs are tolerable and which are not. Without your input, survey teams may find
themselves making judgment calls based on their assumptions about how you will use the data; even
experienced survey designers may make the wrong choice if they do not know your priorities.
Reasons you want to be involved in survey design: Decisions made during design will
impose permanent, irreversible constraints on how data can be used.
• You may be tempted to think that even if you cannot get the sample size you need for the analyses
you desire; a small survey will be better than nothing. This is not true. There is likely to be a
better use for your resources, because an underpowered survey will not give you the information
you want.
April 2020 | 19
A Commissioner’s Guide to Probability Sampling for Surveys at USAID
• If your survey is underpowered, you probably won’t be able to answer the questions you want to
answer about your data, but you also won’t know why your findings are weak. You won’t be able to
tell if they’re weak because there’s no finding to detect, or if they’re weak because your survey was
simply too underpowered to detect it.
• The sample size you need depends on the statistics you plan to use. Survey teams need a very clear
idea of your data needs and the intended use of the findings to know what statistical analyses are
likely to be needed. Discuss the kind of statistics that meet your use needs with the survey team
before they finalize the sampling design.
• Sampling determines who is represented by the data; if you want all voices represented in your
survey, you have to be confident in your sampling design and your ability to generalize. Discuss the
issue of generalizability directly with your survey team, and know the selection rules at each stage of
sampling.
April 2020 | 20

A Commissioner’s Guide to Probability Sampling for Surveys at USAID
About the Authors
The authors are staff from MECap*.
Julie Uwimana has been with MECap since 2016, previously serving as an M&E Fellow with the Bureau for Policy,
Planning and Learning (PPL), and the Monitoring, Evaluation, and Learning team in the Bureau for Food Security (BFS).
While at BFS, she supported the Feed the Future Zone of Influence representative surveys in Mali and Ethiopia. Before
joining USAID, she spent seven years working on monitoring, evaluation, and learning with USAID implementing
partners, as well as the Department of State. She holds a Master’s Degree in International Development from the
Graduate School of Public and International Affairs at the University of Pittsburgh.
Jennifer Kuzara has been with MECap since 2015, serving as an M&E Fellow with USAID Somalia and the Middle East
Bureau before joining MECap's core team as a Senior M&E Specialist. Prior to joining USAID, she worked with CARE
in Atlanta for seven years, where she led and supported population-based surveys and contributed to the development
and piloting of a socio-psychological tool to measure women's empowerment. She also held a fellowship at the
Centers for Disease Control and Prevention (CDC), where she supported the Community Guide for Preventive
Services in conducting systematic reviews and meta-analyses of public health program evaluations. She holds a Ph.D. in
Anthropology and a Masters of Public Health in Epidemiology from the Rollins School of Public Health, both earned at
Emory University. In addition, she holds a certificate in Global Mental Health from the Harvard Program for Refugee
Trauma and has received supplemental training in Formal Demographic Methods from Stanford University, in
transcultural psychiatry from McGill University, with a focus on the development and validation of conflict-sensitive,
culturally-aware psychometric tools, and in research design and field methods from the National Science Foundation.
*Expanding Monitoring and Evaluation Capacities is an institutional support contract managed by the Bureau for Policy, Planning
and Learning, Office of Learning, Evaluation and Research. MECap collaborates with Mission and Washington offices to deliver specialized
technical assistance that improves planning, design, monitoring, evaluation, and learning practices.
Acknowledgements
The authors would like to thank the colleagues who spent valuable time on reviewing and providing feedback to the
authors on the content and format of this document. The final resource is no doubt stronger for their efforts.
Acknowledgements are due to Jerome Gallagher, Lesley Perlman, and Anne Swindale for early input on the direction
of this resource; to Tonya Giannoni and Virginia Lamprecht for careful review and feedback on the framing and
audience, to Erica Schmidt for assistance with editing and layout; and to Daniel Handel and Joe Amick for volunteering
to review the final product. A special thanks is due to Michaela Gulemetova, who carefully reviewed the statistical
content for accuracy and clarity.
This document is one from a series of MECap Knowledge Products. MECap Knowledge Products include guidance,
templates, training materials, and conceptual frameworks to strengthen Agency processes of planning, commissioning,
and using monitoring data and evaluation findings for strategic learning and planning.
This publication was produced at the request of the United States Agency for International Development (USAID). It
was prepared under the MECap task order, contract number AID-OAA-M-14-00014, managed by Social Solutions
International. The views expressed in this publication do not necessarily reflect the views of USAID.
April 2020 | 21

A Commissioner’s Guide to Probability Sampling for Surveys at USAID
Annex A: Sampling Design Review Checklist
Sampling Review Checklist
A population-based survey is
needed
Population-based surveys sho uld not be chosen lightly. They are
more complicated than some other kinds of surveys because they
typically require multistage sampling, which can be more expensive
and time-consuming than other approaches. They should only be
used when it is essential to characterize the whole population of an
entire geographic area. In many cases, study questions focused on
project beneficiaries can be answered using simpler sampling
approaches that are representative of the beneficiary group (but not
necessarily the larger population).
Use of the findings are clear How does the information gathered align with the project for
activity theories of change? What are the programmatic implications
of the findings? Use should be at the forefront of decision-making
when determining the variables for the analysis.
What are the ‘need to know’ and ‘good to know’ characteristics to
be collected? The more variables and characteristics being collected
in the survey, the more costly it will be. Using a shorter survey may
allow for a larger sample within the same budget.
What sub-populations might be of interest in the analysis? If a sub-
analysis is planned on a minority group, over-sampling may be
needed to attain adequate representation.
An intentional sampling
design exists
If a design document mentions sampling, it should also explain how
the sampling will be conducted. The design should include step-by-
step processes for sampling unit selection. For example, is it simple
random sampling from a beneficiary list or multistage-stage cluster
sampling? If the latter, have they explained sampling at each stage,
including how clusters will be selected? This information should be
clear.
Randomness is clearly
identified
Confirm that each stage of sampling for which generalizability is
desired has an element of randomness. What is important is that
each stage of sampling should be clearly explained with respect to
why and how randomization is being introduced or not. If selection
is purposive - particularly in the first stage of sampling - it affects
generalizability.
Appropriate sample frame Compare the sample frame identified in the design to the subject of
the study question being investigated. In an effort to cut time and
cost, a survey team may propose a sample frame smaller than what
is needed for the desired generalizability. This is problematic. The
data from a representative study can only be generalized to the
population included in the sample frame. For example, if your frame
includes only adults aged 25-60, you cannot generalize to those
outside this age range.
Limitations are clearly
addressed
Sample frames are imperfect. Limitations that exist with the
selection of a sample frame should be recorded in detail.
April 2020 | 22
Sampling Review Checklist
A Commissioner’s Guide to Probability Sampling for Surveys at USAID
Design effect is justified If your survey includes a cluster design, then the sample size
calculation includes a design effect estimate. Design effects can be
naturally lowered without increasing the sample size by visiting and
sampling fewer respondents, each from a larger number of clusters.
However, a sampling design that includes a large number of clusters
is more expensive than a sampling design that uses fewer because of
the increased need for travel, logistics planning, and time.
Although lowering a design effect estimate is tempting because it
lowers the sample size calculated, the design effect itself will be
based on the actual nature of your data; underestimating it will
result in an underpowered survey, which is wasteful of the
resources invested in conducting the survey. An underpowered
survey is not “better than nothing” -- if the budget is not
sufficient for an adequate sample size using the most accurate
available estimates, the survey commissioners should consider
narrowing the scope of the survey or using an alternative to a
population-based survey.
Effect size is justified The smaller effect size, the larger the sample size needed to detect
it. However, misjudging or unjustifiably increasing an effect size
estimate in your sample size calculation in order to decrease sample
size can lead t o an underpowered survey. Ensure that the estimated
effect size is justified based on comparable research and anticipated
results.
Use of standard parameters
Power, confidence level, and margin of error are parameters with a
range of common standard values. When reviewing a sampling
design, ensure that the values for these parameters fall within those
standards.
Non-response is applied In all voluntary data collection efforts, some respondents will choose
not to participate or to refuse to answer some questions. The
higher the estimated non-response rate, the larger the sample size
will need to be. In longitudinal or panel surveys, there should also be
a separate correction applied for attrition.
Source: This survey checklist was c ompiled by the authors to assist commissioners in ensuring that their
sampling design is complete and technically sufficient to meet their aims.
April 2020 | 23

A Commissioner’s Guide to Probability Sampling for Surveys at USAID
Annex B: Examples of Statistical Tests for Variable Combinations
This table is intended to be illustrative of the most common test for each scenario; for each test, however,
there may be variations or exceptions. Examine all the options for the particular case under review before
deciding on a test or tests. In order to match a significance test to the data being studied, it is critical to also
understand the assumptions included within each inference test.
What kind of variable is
your outcome?
(This is your dependent
variable)
What kinds of
variables are likely
to affect your
outcome? (This is
your independent
variable)
Example questions Applicable statistical
test
In t his table, you will find information on which statistical tests can be u sed, depending on the n ature of your dependent (or
outcome) variable, and which and how m any independent variables you are considering. These t ests generally test whether
the relationship between two variables is significant or they model the p robability of an outcome g iven a set of conditions.
The i nformation is designed to help you determine whether the t ests suggested by your survey team t o inform
sample size calculations are the appropriate o nes for your needs. The l ist of suggested tests is not exhaustive; and
in some cases, additional information ( such a s the distribution o f a variable or whether it meets certain assumptions) will
influence the choice of test.
For each type of dependent variable, we provide examples of tests of the relationship between that variable and a single
independent variable, as well as what tests to consider when there are multiple independent variables. Please note that in
most cases, multivariate tests will use regression; there are many specific types of regression modeling, depending on the
types of variable as well as on the behavior of the data in a given study. This table does not attempt to provide guidance at
that level. Please consult a statistician or established statistical resource for more information on the specific tests and when
and how to apply them.
Nominal (Binary)
N
ominal variables are those
whos
e values are named but
have no ordered meaning or
numerical significance. Binary
variables are nominal variables
with only two possible values.
This includes all variables with
a yes/no outcome and those
measuring the presence or
absence of a condition.
Nominal (Binary) Are wom
en more likely than
men to be unemployed?
Chi-square or Fisher’s Exact
Nominal (Categorical)
Do people i n rural, peri-
urban, or urban areas have
different rates of COPD?
Chi-square
Ordinal
Was grade level associated
with the intention to attend
college?
Chi-square trend test or
Wilcoxon-Mann-Whitney or
Wilcoxon Signed Rank
Ratio or interval
Did household income affect
the likelihood of attending
college?
Logistic regression (or
probit)
Multiple independent
variables
Did household income affect
the likelihood of attending
college, after controlling for
college attendance in other
family members?
Logistic regression (or
probit)
April 2020 | 24

A Commissioner’s Guide to Probability Sampling for Surveys at USAID
What kind of variable is
your outcome?
(This is your dependent
variable)
What kinds of
variables are likely
to affect your
outcome? (This is
your independent
variable)
Example questions Applicable statistical
test
Nominal (Categorical)
Categorical variables are
nominal
variables with multiple
possible answer choices (so
long as the answer choices are
not ordered). Examples
include: race or ethnicity,
marital status, political party
affiliation.
Nominal (Binary)
Is there a difference between
women and men in whether
they have no diabetes, Type 1
diabetes, or Type 2 diabetes?
Chi-square
Nominal (Categorical)
Are there differences by race
in political party registration?
Chi-square
Ordinal
Was the level of educational
attainment associated with the
make of car purchased?
There is no good test for
this combination of variables;
consider transformation of
the ordinal variable to a
binary one
Nominal (Categorical)
continued
Ratio or interval
Did the average daily
temperature during the week
of the election have an effect
on voting outcomes
(multiparty)?
There is no good test for
this combination of variables;
consider transformation of
the categorical variable, or
use a Poisson test only after
ensuring assumptions are
met
Multiple independent
variables
Did the a verage da ily
temperature during the week
of the election have an effect
on voting outcomes
(multiparty) after controlling
for precipitation and age?
Multiple logistic regression
Ordinal
Ordinal variables are those
whose va
lues are named and
ordered but not inherently
numeric. Examples include:
Likert-scale data, socio-
economic status, course
grades, age (when divided
into categories).
Nominal (Binary)
Did girls or boys have higher
average grades?
Chi-square-trend test or
Mann-Whitney test
Nominal (Categorical) Did people living in different
administrative districts have
different levels of satisfaction
with government services?
Kruskal-Wallis
Ordinal
Was the level of
socioeconomic status
associated with satisfaction
with the performance of a
local politician?
Spearman Rank-Order
Correlation
Ratio or interval
Was average body weight
associated with satisfaction
(on a four-point Likert scale)
with care received during
medical appointments?
There is no good test for
this combination of variables;
consider transformation of
the ordinal variable or use
ordered logistic regression
only after ensuring
assumptions are met
April 2020 | 25

A Commissioner’s Guide to Probability Sampling for Surveys at USAID
What kind of variable is
your outcome?
(This is your dependent
variable)
What kinds of
variables are likely
to affect your
outcome? (This is
your independent
variable)
Example questions Applicable statistical
test
Multiple independent
variables
Was average b ody weight
associated with satisfaction
(on a four-point Likert scale)
with care received during
medical appointments, after
controlling for sex and age?
Ordered logistic regression if
assumptions are m et
Ratio or interval
Ratio variables are
continuous numerical
variables in which zero has a
unique, meaningful value,
and no negative values are
possible. Examples include
height, weight, or cost.
Nominal (Binary)
Is the m ean daily temperature
higher across Michigan
weather stations than i t was
on the s ame d ate 2 0 years
ago?
Student’s T-test
Nominal (Categorical)
Are there significant
differences by region of the
United States in the a mount
of television w atched?
ANOVA
Ratio or interval
continued
Interval variables are
continuous numerical
variables for which there is
an equal interval between
each pair of neighboring
values and in which negative
values are possible.
Examples: Temperature
measured in F or C; time
measured against calendar
years.
The same kinds of tests are
generally used for ratio and
interval variables; but ratio
variables can be multiplied by
one another to create
composite variables, while
interval variables cannot.
Ordinal
Was satisfaction with
government services (on a
four-point Likert scale)
associated with media
consumption (in hours)?
Spearman Rank-Order
Correlation
Ratio or interval
Was household income i n
childhood associated with
earnings 20 years later?
Pearson Correlation or
linear regression
Multiple independent
variables
Was household income i n
childhood associated with
earnings 20 years later,
controlling for sex and year of
birth?
ANCOVA or multiple
logistic regression
April 2020 | 26

-
A Commissioner’s Guide to Probability Sampling for Surveys at USAID
Annex C: Sampling Approaches
This section provides an overview of the strengths and limitations of common types of probability and non-
probability sampling.
Types of Sampling Approaches
Sampling
Type
Prob. /
Non-
Prob.
Best used when… Limitations
Simple
Random
Probability …lists of unique identifiers (names,
addresses, and phone numbers) are available
from which to sample. This design has the
lowest potential for sampling error.
Expensive and usually infeasible for
population-based surveys (e.g., those
that represent an entire geographic
region).
Systematic
Random
Sampling
Probability
…the population is defined, exhaustive, and
in list form (e.g., beneficiary list).
Not possible when population is
undefined.
Stratified
Probability
…population characteristics (e.g., age range,
school grade) are an important
consideration in an analysis because it allows
for representative sub-analysis between
strata.
You need access to information about
the stratification variable at the time of
sampling in order to use this approach.
Cluster
Probability
…sampling of smaller-scale geographic units
is desirable, for programmatic reasons (e.g.,
interventions were conducted at the
community level) or logistical reasons (e.g.,
communities are far apart, remote, or
difficult to get to, or the budget does not
allow for enumerators to cover a large
geographic area).
Increases potential for sampling error,
and requires statistical corrections and a
larger sampling size for the same survey
power.
Multi-Stage
Probability
…along with cluster sampling, or any time
dividing the population into progressively
smaller units, is helpful (e.g., sampling a
town, then a household, then a respondent
within the household).
Increases potential for sampling error,
and requires statistical corrections and a
larger sample size for the same survey
power.
Convenience
Non-
Probability
…you are interested in interactions with a
particular space, facility, or resource (e.g.,
experiences of health clinic visitors in the
afternoon vs. morning hours).
Not appropriate for representative
samples or generalizing to a population
larger than those sampled.
Purposive
Non-
Probability
…when you are interested in learning more
about a specific group of people (e.g.,
members of the PTA, auto-mechanics, fruit
vendors).
Not suitable for use when you need to
generalize findings beyond the group
being studied.
Snowball
Non-
Probability
…you need to understand a specific
network or group (e.g., when conducting
social network analysis), particularly of hard-
to-find people or people w ith a specific or
rare i nterest (e.g., IV drug-users,
revolutionary war reenactors).
The initial sample may introduce bias
into the overall sample because you will
be accessing an existing social network,
in which traits may be shared. Not
suitable for use when you need to
generalize findings beyond the group
being studied.
April 2020 | 27

A Commissioner’s Guide to Probability Sampling for Surveys at USAID
Annex D: Common Sample Size Parameters
Common Sample Size Parameters
Parameters Description Symbolic
Notation
Method of Selection
Power
The probability that, if there is an effect or
relationship, in reality, you will be able to detect
it with the design you have chosen. It is based
on your sample size, effect size, and significance
level. It is standard to use 80 or 90 percent.
β
Choose from among
agreed standards
Effect Size
The strength of a relationship between two
variables.
d
Data-driven estimation
Alpha
Alpha is the probability that you will find
something significant even though it is not
there. (Type 1 error or false positive.)
Remember that the level you set for alpha
determines the significance level and confidence
level in your analysis
α
Choose from among
agreed standards
Confidence Level
The probability that the value of a parameter
falls within a specified range of values.
1-α
Choose from among
agreed standards
Margin of Error
The amount of random error you wish to allow
in your results.
E
Agreed Standard
Design Effect
The ratio of the actual variance in a sample due
to aspects of the design to an estimate of what
the variance would have been in a simple
random sample of the population.
D
eff
Data-driven estimation
April 2020 | 28

A Commissioner’s Guide to Probability Sampling for Surveys at USAID
Annex E: Timeframe
The length of time required to complete your survey will depend on a variety of factors, including the scope,
sample size, purpose, the amount of development required for survey tools (i.e., are you using pre-validated
tools or developing and validating new tools?), and the amount of stakeholder engagement and feedback
required. It is reasonable to estimate at least a one-year total lifespan for studies with a representative
survey component, for example. This timeline has been adapted from the Feed the Future Zone of Influence
Survey Toolkit, Gantt Chart Timeline.
Illustrative Timeframe
Phase Illustrative Tasks Approximate
Time
Notes
Preparation
● Prepare study design and
implementation plan
● Prepare sample design
● Survey i
nstrument design
● Complete translations
● Submit for Internal Review
Board (IRB) approval
● Develop pretest and pilot
protocols
● Prepare data structure and
codebook
● Prepare data cleaning plan
● Develop data monitoring
plan
3-6 months
At the preparation stage, the IRB
process should be made clear by
the implementer. Often IRB
approval can take time and, if not
adequately planned for delay data
collection.
Develop
Training
Materials, if
needed
● Develop training schedules
● Devel
op training content
● Develop
testing materials
1-2 months
Both the enumerators and
enumerator supervisors will need
to be trained in the survey
content, purpose, and protocols.
In some cases, training materials
will only need to be adapted and
not created.
Household
Identification
and Selection
● Acquire or compile a list of
each household in the
sampled clusters/EAs
● Confirm population
estimates
● P
repare data weighting
protocol
1 month
This step will depend on the
desired approach to household
selection. No matter the
approach, households within each
of the selected clusters will need
to be identified and documented,
and the cluster populations
confirmed.
April 2020 | 29

A Commissioner’s Guide to Probability Sampling for Surveys at USAID
Illustrative Timeframe
Phase Illustrative Tasks Approximate
Time
Notes
Conduct
Trainings
● Tra
ining of traine
rs
● Train enumerators
● Train supe
rvisors, etc.
1 month or
less
Time needs to be allocated to
the actual trainings after the
training materials are developed
or appropriately adapted. Too
much time between training and
field work should be avoided
because enumerators forget
some of the information.
Conduct
Data
Collection
● Deploy enumerators to
assigned clusters
● Complete questionnaires
with sel
ected households
2-3 months
Depending on the design,
households m ight be interviewed
at the time of selection. If the
design lists the households first
and then randomizes the
selection based on the list,
interviewing might encompass
separate steps as it is here.
Clean Data
● Review data for
inconsistencies, enumerator
errors, etc.
● Compile data into preferred
format f
or the data set
1-2 months
Implement the data cleaning plan
developed in the preparation
stage.
Analyze Data
● Run predetermined statistical
tests
● Review findings
2-4 months
Often survey managers can ask
for key findings or key data tables
to be submitted around this time
before the report is complete
and approved.
Write
Report
● Draft report content
● Coordinate with relevant
stakeh
olders to review and
edit draft
● Finalize report
1-2 months
Total Timeframe
12 -18 months
April 2020 | 30

A Commissioner’s Guide to Probability Sampling for Surveys at USAID
Annex F: Terms
Alpha
The probability of rejecting the null hypothesis when the null hypothesis is true or
the probability of being incorrect.
Cluster The sampling cluster, or simply cluster, is the smallest area unit selected for a
survey.
Cluster Sample A cluster sample is a special kind of multistage sample. In cluster sampling, you
divide the population into clusters, select a subset of those clusters, and then
select a sample from within each of the selected clusters.
Confidence Level A measure of the validity of your results.
Convenience Sample Non-probabilistic sampling where selection is based on convenience
of contact.
Descript
ive Statistics Provides a concise summary of data, numerically or graphically.
Design Effect (DEF) An additional error that is introduced by the sampling design.
Effect Size An estimation of change to be detected.
Effective Sample Size Equal to the actual sample size divided by the design effect.
Enumeration Areas
Small geographic units specifically designed for census data collection and often
designed to be equal in size, making sampling from them much more
straightforward.
Inferential Statistics
Use a random sample of data taken from a population to make inferences or test
hypotheses about a population.
Intraclass
Correlation
Coefficient
A measure of the similarity among units in a cluster relative to the similarity
among units across multiple clusters.
Limitation
Any significant weakness in the survey design by which the findings could be
influenced.
Margin of Error A measure of the precision of your results.
Multi-Stage Sample Multi-stage sampling starts with the primary sampling unit (PSU) and divides the
population into smaller and smaller configurations before sampling.
Non-probabilistic
Sampling
Uses purposeful selection and judgement factors to choose sampling units.
Oversampling A special type of stratified sampling in which disproportional numbers of sampling
units are selected from specific strata.
Parameters Values that need to be set so that a sample size calculation can be completed.
April 2020 | 31

A Commissioner’s Guide to Probability Sampling for Surveys at USAID
Terms Continued
P
rimary Sampling
Unit
The unit selected in the first stage of sampling of a multi-stage sampling design.
Probabilistic
Sampling
Every sampling unit (e.g., person or household or school) within the sample frame
has some probability of being selected.
Purposive Sample A non-probabilistic sampling method that chooses the sample based on specific
characteristics.
Representative
Sample
A sample that accurately reflects the characteristics of a study population and
minimizes bias.
Sample Frame A group of units from which a subset is drawn.
Sample Size Sample size is the number of respondents needed to estimate the statistics of the
population of interest with sufficient precision for the inferences you want to
make.
Sampling Bias Bias that results when the traits of the units within the sample frame are different
from those in the population that you are trying to study.
Simple Random
Sample
Simple random sampling is an approach where every unit in the sample frame has
roughly the same probability of being selected.
Snowball Sample A non-probabilistic sampling method whereby study subjects refer other study
subjects to the researcher.
Statistical Error
The unknown difference between an estimated value from a sample and the
“true” value based on the whole population.
Stratified Sample Stratified sampling splits an entire population into homogeneous groups or strata
before sampling. The sample is then selected randomly from each stratum.
Study Population The group of people study questions are being asked about. More explicitly, the
study population are the units that the sample is expected to represent.
Systematic Random
Sample
In systematic random sampling, sampling units are selected according to a random
starting point and a fixed, periodic interval. Selection begins with an ordered or
randomized list, and every r-th sampling unit are selected.
True Value A value that would result from ideal measurement.
April 2020 | 32

A Commissioner’s Guide to Probability Sampling for Surveys at USAID
Resources
During the creation of this guide, the authors used the following resources to validate the content and
definitions presented. These resources might also be useful to you as they provide detailed information on
sampling and statistics.
● The USAID Feed the Fu
ture ZOI Survey toolkit provides in depth technical guidance for survey
implementers. The guidance is specific to the Feed the Future initiative but also a great reference for
more advanced technical information - in particular, the Listing Manual, Sampling Guide, and the
Gantt Chart Timeline.
● Health Knowledge page on Statistical Methods and University of Minnesota, CYFAR pages explain in
detail the different types of statistical tests available based on variable types and usage.
● The Sample Size and Power Calculations chapter f
rom Dr. Andrew Gelman at Columbia University
and this article from the International Journal of Epidemiology describe the statistical concepts
behind sample size calculations.
● This Minitab Blog entry offers
a very clear breakdown on the meaning and interconnectivity
between confidence level, confidence intervals, margin of error, and significance.
● Survey Sampling by Lesli
e Kish is a seminal text informing the practice of survey sampling; it provides
additional explanations for several of the methods and rules of thumb explained here and is the
source of the eponymous Kish grid used frequently for household surveys. (1965. John Wiley &
Sons, Inc. New York).
● USAID’s Technical Note on Impact Evaluation provides an overview of experimental and quasi-
experimental designs for evaluations.
● The World Bank Group and the International Development Bank produced th
e Impact Evaluation in
Practice handbook, now in its second edition. Readers who want to explore experimental and quasi-
experimental
designs i
n greater depth can refer to this resource, which also includes a chapter with
guidance for practitioners on sampling approaches.
April 2020 | 33
