
NISTIR 8280
Face Recognition Vendor Test (FRVT)
Part 3: Demographic Effects
Patrick Grother
Mei Ngan
Kayee Hanaoka
This publication is available free of charge from:
https://doi.org/10.6028/NIST.IR.8280

NISTIR 8280
Face Recognition Vendor Test (FRVT)
Part 3: Demographic Effects
Patrick Grother
Mei Ngan
Kayee Hanaoka
Information Access Division
Information Technology Laboratory
This publication is available free of charge from:
https://doi.org/10.6028/NIST.IR.8280
December 2019
U.S. Department of Commerce
Wilbur L. Ross, Jr., Secretary
National Institute of Standards and Technology
Walter Copan, NIST Director and Undersecretary of Commerce for Standards and Technology
Certain commercial entities, equipment, or materials may be identified in this
document in order to describe an experimental procedure or concept adequately.
Such identification is not intended to imply recommendation or endorsement by the
National Institute of Standards and Technology, nor is it intended to imply that the
entities, materials, or equipment are necessarily the best available for the purpose.
National Institute of Standards and Technology Interagency or Internal Report 8280
Natl. Inst. Stand. Technol. Interag. Intern. Rep. 8280, 81 pages (December 2019)
This publication is available free of charge from:
https://doi.org/10.6028/NIST.IR.8280

This publication is available free of charge from: https://doi.org/10.6028/NIST.IR.8280
2019/12/19 08:14:00 FRVT - FACE RECOGNITION VENDOR TEST - DEMOGRAPHICS 1
EXECUTIVE SUMMARY
OVERVIEW This is the third in a series of reports on ongoing face recognition vendor tests (FRVT) ex-
ecuted by the National Institute of Standards and Technology (NIST). The first two reports
cover, respectively, the performance of one-to-one face recognition algorithms used for ver-
ification of asserted identities, and performance of one-to-many face recognition algorithms
used for identification of individuals in photo data bases. This document extends those eval-
uations to document accuracy variations across demographic groups.
MOTIVATION The recent expansion in the availability, capability, and use of face recognition has been ac-
companied by assertions that demographic dependencies could lead to accuracy variations
and potential bias. A report from Georgetown University [14] work noted that prior stud-
ies [22], articulated sources of bias, described the potential impacts particularly in a policing
context, and discussed policy and regulatory implications. Additionally, this work is moti-
vated by studies of demographic effects in more recent face recognition [9,16, 23] and gender
estimation algorithms [5, 36].
AIMS AND
SCOPE
NIST has conducted tests to quantify demographic differences in contemporary face recog-
nition algorithms. This report provides details about the recognition process, notes where
demographic effects could occur, details specific performance metrics and analyses, gives
empirical results, and recommends research into the mitigation of performance deficiencies.
NIST intends this report to inform discussion and decisions about the accuracy, utility, and
limitations of face recognition technologies. Its intended audience includes policy makers,
face recognition algorithm developers, systems integrators, and managers of face recognition
systems concerned with mitigation of risks implied by demographic differentials.
WHAT WE DID The NIST Information Technology Laboratory (ITL) quantified the accuracy of face recogni-
tion algorithms for demographic groups defined by sex, age, and race or country of birth.
We used both one-to-one verification algorithms and one-to-many identification search algo-
rithms. These were submitted to the FRVT by corporate research and development laborato-
ries and a few universities. As prototypes, these algorithms were not necessarily available as
mature integrable products. Their performance is detailed in FRVT reports [16,17].
We used these algorithms with four large datasets of photographs collected in U.S. govern-
mental applications that are currently in operation:
Domestic mugshots collected in the United States.
Application photographs from a global population of applicants for immigration benefits.
Visa photographs submitted in support of visa applicants.
Border crossing photographs of travelers entering the United States.
All four datasets were collected for authorized travel, immigration or law enforcement pro-
cesses. The first three sets have good compliance with image capture standards. The last set
does not, given constraints on capture duration and environment. Together these datasets al-
lowed us to process a total of 18.27 million images of 8.49 million people through 189 mostly
commercial algorithms from 99 developers.
Links:
EXEC. SUMMARY
TECH. SUMMARY
False positive: Incorrect association of two subjects 1:1 FMR 1:N FPIR
False negative: Failed association of one subject 1:1 FNMR 1:N FNIR
T 0 → FMR, FPIR → 0
→ FNMR, FNIR → 1

This publication is available free of charge from: https://doi.org/10.6028/NIST.IR.8280
2019/12/19 08:14:00 FRVT - FACE RECOGNITION VENDOR TEST - DEMOGRAPHICS 2
The datasets were accompanied by sex and age metadata for the photographed individuals.
The mugshots have metadata for race, but the other sets only have country-of-birth informa-
tion. We restrict the analysis to 24 countries in 7 distinct global regions that have seen lower
levels of long-distance immigration. While country-of-birth information may be a reasonable
proxy for race in these countries, it stands as a meaningful factor in its own right particularly
for travel-related applications of face recognition.
The tests aimed to determine whether, and to what degree, face recognition algorithms dif-
fered when they processed photographs of individuals from various demographics. We as-
sessed accuracy by demographic group and report on false negative and false positive ef-
fects. False negatives are the failure to associate one person in two images; they occur when
the similarity between two photos is low, reflecting either some change in the person’s ap-
pearance or in the image properties. False positives are the erroneous association of samples
of two persons; they occur when the digitized faces of two people are similar.
In background material that follows we give examples of how algorithms are used, and we
elaborate on the consequences of errors noting that the impacts of demographic differentials
can be advantageous or disadvantageous depending on the application.
WHAT WE
FOUND
The accuracy of algorithms used in this report has been documented in recent FRVT eval-
uation reports [16, 17]. These show a wide range in accuracy across developers, with the
most accurate algorithms producing many fewer errors. These algorithms can therefore be
expected to have smaller demographic differentials.
Contemporary face recognition algorithms exhibit demographic differentials of various mag-
nitudes. Our main result is that false positive differentials are much larger than those related
to false negatives and exist broadly, across many, but not all, algorithms tested. Across demo-
graphics, false positives rates often vary by factors of 10 to beyond 100 times. False negatives
tend to be more algorithm-specific, and vary often by factors below 3.
False positives: Using the higher quality Application photos, false positive rates are high-
est in West and East African and East Asian people, and lowest in Eastern European in-
dividuals. This effect is generally large, with a factor of 100 more false positives between
countries. However, with a number of algorithms developed in China this effect is re-
versed, with low false positive rates on East Asian faces. With domestic law enforcement
images, the highest false positives are in American Indians, with elevated rates in African
American and Asian populations; the relative ordering depends on sex and varies with
algorithm.
We found false positives to be higher in women than men, and this is consistent across
algorithms and datasets. This effect is smaller than that due to race.
We found elevated false positives in the elderly and in children; the effects were larger in
the oldest and youngest, and smallest in middle-aged adults.
Links:
EXEC. SUMMARY
TECH. SUMMARY
False positive: Incorrect association of two subjects 1:1 FMR 1:N FPIR
False negative: Failed association of one subject 1:1 FNMR 1:N FNIR
T 0 → FMR, FPIR → 0
→ FNMR, FNIR → 1

This publication is available free of charge from: https://doi.org/10.6028/NIST.IR.8280
2019/12/19 08:14:00 FRVT - FACE RECOGNITION VENDOR TEST - DEMOGRAPHICS 3
False negatives: With domestic mugshots, false negatives are higher in Asian and Ameri-
can Indian individuals, with error rates above those in white and African American faces
(which yield the lowest false negative rates). However, with lower-quality border crossing
images, false negatives are generally higher in people born in Africa and the Caribbean,
the effect being stronger in older individuals. These differing results relate to image qual-
ity: The mugshots were collected with a photographic setup specifically standardized to
produce high-quality images across races; the border crossing images deviate from face
image quality standards.
In cooperative access control applications, false negatives can be remedied by users making
second attempts.
The presence of an enrollment database affords one-to-many identification algorithms a re-
source for mitigation of demographic effects that purely one-to-one verification systems do
not have. Nevertheless, demographic differentials present in one-to-one verification algo-
rithms are usually, but not always, present in one-to-many search algorithms. One impor-
tant exception is that some developers supplied highly accurate identification algorithms for
which false positive differentials are undetectable.
More detailed results are introduced in the Technical Summary.
IMPLICATIONS
OF THESE
TESTS
Operational implementations usually employ a single face recognition algorithm. Given
algorithm-specific variation, it is incumbent upon the system owner to know their algo-
rithm. While publicly available test data from NIST and elsewhere can inform owners, it
will usually be informative to specifically measure accuracy of the operational algorithm on
the operational image data, perhaps employing a biometrics testing laboratory to assist.
Since different algorithms perform better or worse in processing images of individuals in
various demographics, policy makers, face recognition system developers, and end users
should be aware of these differences and use them to make decisions and to improve future
performance. We supplement this report with more than 1200 pages of charts contained in
seventeen annexes that include exhaustive reporting of results for each algorithm. These are
intended to show the breadth of the effects, and to inform the algorithm developers.
There are a variety of techniques that might mitigate performance limitations of face recogni-
tion systems performance issues overall and specifically those that relate to demographics.
This report includes recommendations for research in developing and evaluating the value,
costs, and benefits of potential mitigation techniques - see sections 8 and 9.
Reporting of demographic effects often has been incomplete in academic papers and in me-
dia coverage. In particular, accuracy is discussed without stating the quantity of interest be
it false negatives, false positives or failure to enroll. As most systems are configured with a
fixed threshold, it is necessary to report both false negative and false positive rates for each
demographic group at that threshold. This is rarely done - most reports are concerned only
with false negatives. We make suggestions for augmenting reporting with respect to demo-
graphic difference and effects.
Links:
EXEC. SUMMARY
TECH. SUMMARY
False positive: Incorrect association of two subjects 1:1 FMR 1:N FPIR
False negative: Failed association of one subject 1:1 FNMR 1:N FNIR
T 0 → FMR, FPIR → 0
→ FNMR, FNIR → 1

This publication is available free of charge from: https://doi.org/10.6028/NIST.IR.8280
2019/12/19 08:14:00 FRVT - FACE RECOGNITION VENDOR TEST - DEMOGRAPHICS 4
BACKGROUND: ALGORITHMS, ERRORS, IMPACTS
FACE
ANALYSIS:
CLASSIFICA-
TION,
ESTIMATION,
RECOGNITION
Before presenting results in the Technical Summary we describe what face recognition is,
contrasting it with other applications that analyze faces, and then detail the errors that are
possible in face verification and identification and their impacts.
Much of the discussion of face recognition bias in recent years cites two studies [5, 36] show-
ing poor accuracy of face gender classification algorithms on black women. Those studies
did not evaluate face recognition algorithms, yet the results have been widely cited to indict
their accuracy. Our work was undertaken to quantify analogous effects in face recognition
algorithms. We strongly recommend that reporting of bias should include information about
the class of algorithm evaluated. We use the term face analysis as an umbrella for any al-
gorithm that consumes face images and produces some output. Within that are estimation
algorithms that output some continuous quantity (e.g., age or degree of fatigue). There are
classification algorithms that aim to determine some categorical quantity such as the sex of a
person or their emotional state. Face classification algorithms are built with inherent knowl-
edge of the classes they aim to produce (e.g., happy, sad). Face recognition algorithms, how-
ever, have no built-in notion of a particular person. They are not built to identify particular
people; instead they include a face detector followed by a feature extraction algorithm that
converts one or more images of a person into a vector of values that relate to the identity
of the person. The extractor typically consists of a neural network that has been trained on
ID-labeled images available to the developer. In operations, they act as generic extractors
of identity-related information from photos of persons they have usually never seen before.
Recognition proceeds as a differential operator: Algorithms compare two feature vectors and
emit a similarity score. This is a vendor-defined numeric value expressing how similar the
parent faces are. It is compared to a threshold value to decide whether two samples are from,
or represent, the same person or not. Thus, recognition is mediated by persistent identity
information stored in a feature vector (or “template”). Classification and estimation, on the
other hand, are single-shot operations from one sample alone, employing machinery that is
different from that used for face recognition.
VERIFICATION Errors: A comparison of images from the same person yields a genuine or “mate” score. A
comparison of images from different people yields an imposter or “nonmate” score. Ideally,
nonmate scores should be low and mate scores should be high. In practice, some imposter
scores are above a numeric threshold giving false positives, and some genuine comparisons
yield scores below threshold giving false negatives.
Applications: One-to-one verification is used in applications including logical access to a
phone or physical access through a security check point. It also supports non-repudiation
e.g. to authorize the dispensing of a prescription drug. Two photos are involved: one in
the database that is compared with one taken of the person seeking access to answer the
question: ”Is this the same person or not?”
Impact of errors: Errors have different implications for the system owner and for the in-
dividual whose photograph is being used, depending upon the application. In verification
applications, false negatives cause inconvenience for the user. For example, an individual
may not be able to get into their phone or they are delayed entering a facility or crossing a
border. These errors can usually be remediated with a second attempt. False positives, on the
other hand, present a security concern to the system owner, as they allow access to imposters.
Links:
EXEC. SUMMARY
TECH. SUMMARY
False positive: Incorrect association of two subjects 1:1 FMR 1:N FPIR
False negative: Failed association of one subject 1:1 FNMR 1:N FNIR
T 0 → FMR, FPIR → 0
→ FNMR, FNIR → 1

This publication is available free of charge from: https://doi.org/10.6028/NIST.IR.8280
2019/12/19 08:14:00 FRVT - FACE RECOGNITION VENDOR TEST - DEMOGRAPHICS 5
IDENT-
IFICATION
Identification algorithms, referred to commonly as one-to-many or “1-to-N” search algo-
rithms, notionally compare features extracted from a search “probe” image with all feature
vectors previously enrolled from “gallery” images. The algorithms return either a fixed num-
ber of the most similar candidates, or only those that are above a preset threshold. A candi-
date is an index and a similarity score. Some algorithms execute an exhaustive search of all
N enrollments and a sort operation to yield the most similar. Other algorithms implement
“fast-search” techniques [2,19,21,26] that avoid many of the N comparisons and are therefore
highly economical [17].
Identification applications: There are two broad uses of identification algorithms. First, they
can be used to facilitate positive access like in one-to-one verification but without presenta-
tion of an identity claim. For example, a subject is given access to a building solely on the
basis of presentation a photograph that matches any enrolled identity with a score above
threshold. Second, they can be used for so-called negative identification where the system
operator claims implicitly that searched individuals are not enrolled - for example, checking
databases of gamblers previously banned from a casino.
Impacts: As with verification, the impact of a demographic differential will depend on the
application. In one-to-many searches, false positives primarily occur when a search of a
subject who is not present in the database yields a candidate identity for human review. This
type of “one to many” search is often employed to check for a person who might be applying
for a visa or driver’s license under a name different than their own. False positives may
also occur when a search of someone who is enrolled produces the wrong identity with, or
instead of, the correct identity. Identification algorithms produce such outcomes when the
search yields a comparison score above a chosen threshold.
In identification applications such as visa or passport fraud detection, or surveillance, a false
positive match to another individual could lead to a false accusation, detention or deporta-
tion. Higher false negatives would be an advantage to an enrollee in such a system, as their
fraud would go undetected, and a disadvantage to the system owner whose security goals
will be undermined.
Investigation: This is a special-case application of identification algorithms where the thresh-
old is set to zero so that all searches will produce a fixed number of candidates. In such
cases, the false positive identification rate is 100% because any search of someone not in the
database will still yield candidates. Algorithms used in this way are part of a hybrid machine-
human system: The algorithm offers up candidates for human adjudication, for which labor
must be available. In such cases, false positive differentials from the algorithm are immaterial
- the machine returns say 50 candidates regardless. What matters then is the human response,
and the evidence there is for both poor [10, 42] and varied human capability, even without
time constraints [34], and sex and race performance differentials, particularly an interaction
between the reviewer’s demographics with those of the photographs under review [7]. The
interaction of machine and human is beyond the scope of this report, as is human efficacy.
Links:
EXEC. SUMMARY
TECH. SUMMARY
False positive: Incorrect association of two subjects 1:1 FMR 1:N FPIR
False negative: Failed association of one subject 1:1 FNMR 1:N FNIR
T 0 → FMR, FPIR → 0
→ FNMR, FNIR → 1

This publication is available free of charge from: https://doi.org/10.6028/NIST.IR.8280
2019/12/19 08:14:00 FRVT - FACE RECOGNITION VENDOR TEST - DEMOGRAPHICS 6
TECHNICAL SUMMARY
This section summarizes the results of the study. This is preceded by an introduction to terminology and
discussion of a vital aspect in reporting demographic effects, namely that it is necessary to report both false
negative and false positive error rates.
ACCURACY
DIFFERENTIALS
When similarity scores are computed over a collection of images from demographic A (say
elderly Asian men) they may be higher than from demographic B (say young Asian women).
We adopt terminology from a Department of Homeland Security Science and Technology
Directorate article [20] and define differential performance as a “difference in the genuine
or imposter [score] distributions”. Such differentials are inconsequential unless they prompt
a differential outcome. An outcome occurs when a score is compared with an operator-
defined threshold. A genuine score below threshold yields a false negative outcome, and an
imposter score at or above threshold, a false positive outcome. The subject of this report is to
quantify differential outcomes between demographics. The term demographic differential is
inherited from an ISO technical report [6] now under development.
FIXED
THRESHOLD
OPERATION
A crucial point in reasoning about differentials is that the vast majority of biometric sys-
tems are configured with a fixed threshold against which all comparisons are made (i.e., the
threshold is not tailored to cameras, environmental conditions or, particularly, demograph-
ics). Most academic studies ignore this point (even in demographics e.g., [13]) by reporting
false negative rates at fixed false positive rates rather than at fixed thresholds, thereby hiding
excursions in false positive rates and misstating false negative rates. This report includes
documentation of demographic differentials about typical operating thresholds.
We report false positive and false negative rates separately because the consequences of each
type of error are of importance to different communities. For example, in a one-to-one access
control, false negatives inconvenience legitimate users; false positives undermine a system
owners security goals. On the other hand, in a one-to-many deportee detection application,
a false negative would present a security problem, and a false positive would flag legitimate
visitors. The prior probability of imposters in each case is important. For example, in some
access control cases, imposters almost never attempt access and the only germane error rate
is the false negative rate.
RESULTS
OVERVIEW
We found empirical evidence for the existence of demographic differentials in the majority of
contemporary face recognition algorithms that we evaluated. The false positive differentials
are much larger than those related to false negatives. False positive rates often vary by one
or two orders of magnitude (i.e., 10x, 100x). False negative effects vary by factors usually
much less than 3. The false positive differentials exist broadly, across many, but not all, algo-
rithms. The false negatives tend to be more algorithm-specific. Research toward mitigation
of differentials is discussed in sections 9 and 8.
The accuracy of algorithms used in this report has been documented in recent FRVT eval-
uation reports [16, 17]. These show a wide range in accuracy across algorithm developers,
with the most accurate algorithms producing many fewer errors than lower-performing vari-
ants. More accurate algorithms produce fewer errors, and will be expected therefore to have
smaller demographic differentials.
Links:
EXEC. SUMMARY
TECH. SUMMARY
False positive: Incorrect association of two subjects 1:1 FMR 1:N FPIR
False negative: Failed association of one subject 1:1 FNMR 1:N FNIR
T 0 → FMR, FPIR → 0
→ FNMR, FNIR → 1

This publication is available free of charge from: https://doi.org/10.6028/NIST.IR.8280
2019/12/19 08:14:00 FRVT - FACE RECOGNITION VENDOR TEST - DEMOGRAPHICS 7
FALSE
NEGATIVES
With regard to false negative demographic differentials we make the observations below.
Note that in real-time cooperative applications, false negatives can often be remedied by
making second attempts.
False negative error rates vary strongly by algorithm, from below 0.5% to above 10%. For
the more accurate algorithms, false negative rates are usually low with average demo-
graphic differentials being, necessarily, smaller still. This is an important result: use of
inaccurate algorithms will increase the magnitude of false negative differentials. See Fig-
ure 22 and Annex 12 .
In domestic mugshots, false negatives are higher in Asian and American Indian individu-
als, with error rates above those in white and black faces. The lowest false negative rates
occur in black faces. This result might not be related to race - it could arise due to differ-
ences in the time elapsed between photographs because ageing is highly influential on face
recognition false negatives. We will report on that analysis going forward. See Figure 17.
False negative error rates are often higher in women and in younger individuals, partic-
ularly in the mugshot images. There are many exceptions to this, so universal statements
pertaining to algorithms false negative rates across sex and age are not supported.
When comparing high-quality application photos, error rates are very low and measure-
ment of false negative differentials across demographics is difficult. This implies that better
image quality reduces false negative rates and differentials. See Figure 22.
When comparing high-quality application images with lower-quality border crossing im-
ages, false negative rates are higher than when comparing the application photos. False
negative rates are often higher in recognition of women, but the differentials are smaller
and not consistent. See Figure 21.
In the border crossing images, false negatives are generally higher in individuals born in
Africa and the Caribbean, the effect being stronger in older individuals. See Figure 18.
FALSE
POSITIVES
Verification Algorithms: With regard to false positive demographic differentials we make
the following observations.
We found false positives to be between 2 and 5 times higher in women than men, the
multiple varying with algorithm, country of origin and age. This increase is present for
most algorithms and datasets. See Figure 6.
With respect to race, false positive rates are highest in West and East African and East
Asian people (but with exceptions noted next). False positive rates are also elevated but
slightly less so in South Asian and Central American people. The lowest false positive
rates generally occur with East European individuals. See Figure 5.
A number of algorithms developed in China give low false positive rates on East Asian
faces, and sometimes these are lower than those with Caucasian faces. This observation -
that the location of the developer as a proxy for the race demographics of the data they used
in training - matters was noted in 2011 [33], and is potentially important to the reduction
of demographic differentials due to race and national origin.
Links:
EXEC. SUMMARY
TECH. SUMMARY
False positive: Incorrect association of two subjects 1:1 FMR 1:N FPIR
False negative: Failed association of one subject 1:1 FNMR 1:N FNIR
T 0 → FMR, FPIR → 0
→ FNMR, FNIR → 1

This publication is available free of charge from: https://doi.org/10.6028/NIST.IR.8280
2019/12/19 08:14:00 FRVT - FACE RECOGNITION VENDOR TEST - DEMOGRAPHICS 8
We found elevated false positives in the elderly and in children; the effects were larger in
the oldest adults and youngest children, and smallest in middle aged adults. The effects
are consistent across country-of-birth, datasets and algorithms but vary in magnitude. See
Figure 14 and Figure 15.
With mugshot images, the highest false positives are in American Indians, with elevated
rates in African American and Asian populations; the relative ordering depends on sex
and varies with algorithm. See Figure 12 and Figure 13.
Identification Algorithms: The presence of an enrollment database affords one-to-many al-
gorithms a resource for mitigation of demographic effects that purely one-to-one verification
systems do not have. We note that demographic differentials present in one-to-one verifica-
tion algorithms are usually, but not always, present in one-to-many search algorithms. See
Section 7.
One important exception is that some developers supplied identification algorithms for
which false positive differentials are undetectable. Among those is Idemia, who publicly
described how this was achieved [15]. A further algorithm, NEC-3, is on many measures,
the most accurate we have evaluated. Other developers producing algorithms with stable
false positive rates are Aware, Toshiba, Tevian and Real Networks. These algorithms also
give false positive identification rates that are approximately independent of the size of en-
rollment database. See Figure 27.
PRIOR WORK This report is the first to describe demographic differentials for identification algorithms.
There are, however, recent prior tests of verification algorithms whose results comport with
ours regarding demographic differentials between races.
Using four verification algorithms applied to domestic mugshots, the Florida Institute of
Technology and its collaborators showed [23] simultaneously elevated false positives and
reduced false negatives in African Americans vs. Caucasians.
Cavazos et al. [8] applied four verification algorithms to GBU challenge images [32] to
show order-of-magnitude higher false positives in Asians vs. Caucasians. The paper artic-
ulates five lessons related to measurement of demographic effects.
In addition, a recent Department of Homeland Security (DHS) Science and Technology /
SAIC study [20] using a leading commercial algorithm showed that pairing of imposters
by age, sex and race gives false positive rates that are two orders of magnitude higher than
by pairing individuals randomly.
On an approximately monthly schedule starting in 2017, NIST has reported [16] on demo-
graphic effects in one-to-one verification algorithms submitted to the FRVT process. Those
tests employed smaller sets of mugshot and visa photographs than are used here.
Links:
EXEC. SUMMARY
TECH. SUMMARY
False positive: Incorrect association of two subjects 1:1 FMR 1:N FPIR
False negative: Failed association of one subject 1:1 FNMR 1:N FNIR
T 0 → FMR, FPIR → 0
→ FNMR, FNIR → 1

This publication is available free of charge from: https://doi.org/10.6028/NIST.IR.8280
2019/12/19 08:14:00 FRVT - FACE RECOGNITION VENDOR TEST - DEMOGRAPHICS 9
WHAT WE DID
NOT DO
This report establishes context, gives results and impacts, and discusses additional research
that can support mitigation of observed deficiencies. It does not address the following:
Training of algorithms: We did not train algorithms. The prototype algorithms submitted
to NIST are fixed and were not refined or adapted. This reflects the usual operational
situation in which face recognition systems are not adapted on customers local data. We
did not attempt, or invite developers to attempt, mitigation of demographic differentials
by retraining the algorithms on image sets maintained at NIST. We simply ran the tests
using algorithms as submitted.
Analyze cause and effect: We did not make efforts to explain the technical reasons for the
observed results, nor to build an inferential model of them. Specifically, we have not tried
to relate recognition errors to skin tone or any other phenotypes evident in faces in our
image sets. We think it likely that modeling will need richer sets of covariates than are
available. In particular, efforts to estimate skin tone and other phenotypes will involve an
algorithm that itself may exhibit demographic differentials.
We did not yet pursue regression approaches due to the volume of data, the number of al-
gorithms tested, and the need to model each recognition algorithms separately, as they are
built and trained independently. Due to their ability to handle imbalanced data, we note,
however, the utiltity of mixed effects models [3, 4, 9] previously developed for explaining
recognition failure. Such approaches can use subject-specific variables (age, sex, race, etc.)
and image-specific variables (contrast, brightness, blur, uniformity, etc.). Models are of-
ten useful, even though it is inevitable that germane quantities will be unavailable to the
analysis.
Consider the effect of cameras: The possible role of the camera, and the subject-camera
interaction, has been detailed recently [9]. This is particularly important when standards-
compliant photography is not possible, or not intended, for example, in high throughput
access control. Without access to human-camera interaction data, we do not report on
quantities like satisfaction, difficulty of use, and failure to enroll. Along these lines, it has
been suggested [41] that NISTs tests using standards-compliant images “don’t translate to
everyday scenarios”.
In fact, we note demographic effects even in high-quality images, notably elevated false
positives. Additionally, we quantify false negatives on a border crossing dataset which is
collected at a different point in the trade space between quality and speed than are our
other three mostly high-quality portrait datasets.
Finally, some governmental organizations dedicated resources to advancing standards so
that the “real-world” images in their applications are high-quality portraits. For example,
the main criminal justice application is supported by the FBI and others being proactive in
the 1990s in establishing portrait capture standards, and then promulgating them.
Use wild images: We did not use image data from the Internet nor from video surveil-
lance. This report does not capture demographic differentials that may occur in such pho-
tographs.
Links:
EXEC. SUMMARY
TECH. SUMMARY
False positive: Incorrect association of two subjects 1:1 FMR 1:N FPIR
False negative: Failed association of one subject 1:1 FNMR 1:N FNIR
T 0 → FMR, FPIR → 0
→ FNMR, FNIR → 1

This publication is available free of charge from: https://doi.org/10.6028/NIST.IR.8280
2019/12/19 08:14:00 FRVT - FACE RECOGNITION VENDOR TEST - DEMOGRAPHICS 10
RESEARCH
RECOMMEND-
ATIONS
We now discuss research germane to the quantification, handling and mitigation of demo-
graphic differentials.
Testing: Since 2017 NIST has provided demographic differential data to developers of one-
to-one verification algorithms. Our goal has been to encourage developers to remediate the
effects. While that may have happened in some cases, a prime incentive for a developer when
participating in NIST evaluations is to reduce false negatives rates globally. Going forward,
we plan to start reporting accuracy that pushes developers to produce approximately equal
false positive rates across all demographics.
Mitigation of false positive differentials: With adequate research and development, the
following may prove effective at mitigating demographic differentials with respect to false
positives: Threshold elevation, refined training, more diverse training data, discovery of fea-
tures with greater discriminative power - particularly techniques capable of distinguishing
between twins - and use of face and iris as a combined modality. These are discussed in
section 9. We also discuss, and discount, the idea of user-specific thresholds.
Mitigation of false negative differentials: False negative error rates, and demographic
differentials therein, are reduced in standards-compliant images. This motivates the sug-
gestions of further research into image quality analysis, face-aware cameras and improved
standards-compliance discussed in section 8.
Policy research: The degree to which demographic differentials could be tolerated has never
been formally specified in any biometric application. Any standard directed toward limit-
ing allowable differentials in the automated processing of digitized biological characteristics
might weigh the actual consequences of differentials which are strongly application depen-
dent.
REPORTING OF
DEMOGRAPHIC
EFFECTS
Reporting of demographic effects has been incomplete, in both academic papers and in me-
dia coverage. In particular, accuracy is discussed without specifying, particularly, false posi-
tives or false negatives. We therefore suggest that reports covering demographic differentials
should describe:
The purpose of the system - initial enrollment of individuals into a system, identity verifi-
cation or identification:
The stage at which the differential occurred - at the camera, during quality assessment, in
the detection and feature extraction phase, or during recognition;
The relevant metric: false positive or false negative occurrences during recognition, failures
to enroll, failed detections by the camera, for example;
Any differentials in duration of processes or difficulty in using the system;
Any known information on recognition threshold value, whether the threshold is fixed,
and what the target false positive rate is;
Which demographic group has the elevated failure rates - for example by age, sex, race,
height, or in some intersection thereof; and
Consequences of any error, if known, and procedures for error remediation.
Links:
EXEC. SUMMARY
TECH. SUMMARY
False positive: Incorrect association of two subjects 1:1 FMR 1:N FPIR
False negative: Failed association of one subject 1:1 FNMR 1:N FNIR
T 0 → FMR, FPIR → 0
→ FNMR, FNIR → 1

This publication is available free of charge from: https://doi.org/10.6028/NIST.IR.8280
2019/12/19 08:14:00 FRVT - FACE RECOGNITION VENDOR TEST - DEMOGRAPHICS 11
ACKNOWLE-
DGMENTS
The authors are grateful to Yevgeniy Sirotin and John Howard of SAIC at the Maryland Test
Facility, Arun Vemury of DHS S&T, Michael King of Florida Institute of Technology, and John
Campbell of Bion Biometrics for detailed discussions of their work in this area.
The authors are grateful to staff in the NIST Biometrics Research Laboratory for infrastructure
supporting rapid evaluation of algorithms.
DISCLAIMER Specific hardware and software products identified in this report were used in order to per-
form the evaluations described in this document. In no case does identification of any com-
mercial product, trade name, or vendor, imply recommendation or endorsement by the Na-
tional Institute of Standards and Technology, nor does it imply that the products and equip-
ment identified are necessarily the best available for the purpose. Developers participating
in FRVT grant NIST permission to publish evaluation results.
ANNEXES
We supplement this report with more than 1200 pages of charts contained in 17 Annexes
which include exhaustive reporting of results for each algorithm. These are intended to show
the breadth of the effects and to inform the algorithms’ developers. We do not take averages
over algorithms, for example the average increase of false match rate in women, because
averages of samples from different distributions are seldom meaningful (by analogy, taking
the average of temperatures in Montreal and Miami). Applications typically employ just one
algorithm, so averages and indeed any statements purporting to summarize the entirety of
face recognition will not always be correct.
The annexes to this report are listed in Table 1. The first four detail the datasets used in
this report. The remaining annexes contain more than 1200 pages of automatically generated
graphs, usually one for each algorithm evaluated. These are intended to show the breadth of
the effects, and to inform the algorithms’ developers.
# CATEGORY DATASET CONTENT
Annex 1 Datasets Mugshot Description and examples of images and metadata: Mugshots
Annex 2 Datasets Application Description and examples of images and metadata: Application portraits
Annex 3 Datasets Visa Description and examples of images and metadata: Visa portraits
Annex 4 Datasets Border crossing Description and examples of images and metadata: Border crossing photos
Annex 5 Results 1:1 Application False match rates for demographically matched impostors
Annex 6 Results 1:1 Mugshot Cross-race and sex false match rates in United States mugshot images
Annex 7 Results 1:1 Application Cross-race and sex false match rates in worldwide application images
Annex 8 Results 1:1 Application False match rates with matched demographics using application images
Annex 9 Results 1:1 Application Cross-age false match rates with application photos
Annex 10 Results 1:1 Visa Cross age false match rates with visa photos
Annex 11 Results 1:1 Mugshot Cross age and country with application photos
Annex 12 Results 1:1 Mugshot Error tradeoff characteristics with United States mugshots
Annex 13 Results 1:1 Mugshot False negative rates in United States mugshot images by sex and race
Annex 14 Results 1:1 Mugshot False negative rates by country for global application and border crossing photos
Annex 15 Results 1:1 Mugshot Genuine and impostor score distributions for United States mugshots
Annex 16 Results 1:N Mugshot Identification error characteristics by race and sex
Annex 17 Results 1:N Mugshot Candidate list score magnitudes by sex and race
Table 1: Annexes and their content.
Links:
EXEC. SUMMARY
TECH. SUMMARY
False positive: Incorrect association of two subjects 1:1 FMR 1:N FPIR
False negative: Failed association of one subject 1:1 FNMR 1:N FNIR
T 0 → FMR, FPIR → 0
→ FNMR, FNIR → 1

This publication is available free of charge from: https://doi.org/10.6028/NIST.IR.8280
2019/12/19 08:14:00 FRVT - FACE RECOGNITION VENDOR TEST - DEMOGRAPHICS 12
TERMS AND DEFINITIONS
The following table defines common terms appearing in this document. A more complete, consistent biomet-
rics vocabulary is available as ISO/IEC 2382 Part 37.
DATA TYPES
Feature vector A vector of real numbers that encodes the identity of a person
Sample One or more images of the face of a person
Similarity score Degree of similarity of two faces in two samples, as rendered by a recognition
algorithm
Template Data produced by face recognition algorithm that includes a feature vector
Threshold Any real number, against which similarity scores are compared to produce a
verification decision
ALGORITHM
COMPONENTS
Face detector Component that finds faces in an image
Comparator Component that compares two templates and produces a similarity score
Searcher Component that searches a database of templates to produce a list of candidates
Template generator Component of a face recognition algorithm that converts a sample into a tem-
plate;
this component implicitly embeds a face detector
ONE-TO-ONE
VERIFICATION
Imposter comparison Comparison of samples from different persons
Genuine comparison Comparison of samples from the same person
False match Incorrect association of two samples from different persons, declared because
similarity score is at or above a threshold
False match rate Proportion of imposter comparisons producing false matches
False non-match Failure to associate two samples from one person, declared because similarity
score is below a threshold
False non-match rate Proportion of genuine comparisons producing false non-matches
Verification The process of comparing two samples to determine if they belong to the same
person or not
ONE-TO-MANY
IDENTIFICA-
TION
Gallery A set of templates, each tagged with an identity label
Consolidated gallery A gallery for which all samples of a person are enrolled under one identifier,
whence N = N
G
Unconsolidated gallery A gallery for which samples of a person are enrolled under different identifiers,
when N < N
G
Identity label Some index or pointer to an identifier for an individual
Identification The process of searching a probe into gallery
Identification decision The assignment either of an identity label or a declaration that a person is not
in the gallery
SYMBOLS
FMR Verification false match rate (measured over comparison of samples)
FNMR Verification false non-match rate (measured over comparison of samples)
FPIR Identification false match rate (measured over comparison of samples)
FNIR Identification false non-match rate (measured over comparison of samples)
N The number of subjects whose faces are enrolled into a gallery
N
G
The number of samples enrolled into a gallery, N
G
≥ N.
N
N M
The number of non-mated searches conducted
N
M
The number of mated searches conducted
Links:
EXEC. SUMMARY
TECH. SUMMARY
False positive: Incorrect association of two subjects 1:1 FMR 1:N FPIR
False negative: Failed association of one subject 1:1 FNMR 1:N FNIR
T 0 → FMR, FPIR → 0
→ FNMR, FNIR → 1

This publication is available free of charge from: https://doi.org/10.6028/NIST.IR.8280
2019/12/19 08:14:00 FRVT - FACE RECOGNITION VENDOR TEST - DEMOGRAPHICS 13
Contents
Acknowledgements 11
Disclaimer 11
Terms and definitions 12
1 Introduction 14
2 Prior work 18
3 Performance metrics 20
4 False positive differentials in verification 28
5 False negative differentials in verification 53
6 False negative differentials in identification 61
7 False positive differentials in identification 66
8 Research toward mitigation of false negatives 70
9 Research toward mitigation of false positives 71
Links:
EXEC. SUMMARY
TECH. SUMMARY
False positive: Incorrect association of two subjects 1:1 FMR 1:N FPIR
False negative: Failed association of one subject 1:1 FNMR 1:N FNIR
T 0 → FMR, FPIR → 0
→ FNMR, FNIR → 1

This publication is available free of charge from: https://doi.org/10.6028/NIST.IR.8280
2019/12/19 08:14:00 FRVT - FACE RECOGNITION VENDOR TEST - DEMOGRAPHICS 14
Recognition
Verification Identification
FNMR
1:1 False
Rejection
FMR
1:1 False
Accept
⟶ Inconvenience
of recapture
⟶ Security hole
FNIR
1:N “Miss
Rate”
FPIR
1:N “False
Alarm”
⟶ Missed lead
⟶ False lead
⟶ Wasted effort
on others
⟶ Displaces actual lead
Face
Detection,
Localization
+Exposure
-Exposure
Feature
Extraction
Quality
Assessment
Acceptance
Human Review
+ Source: http://www.telegraph.co.uk/technology/2016/12/07/robot-passport-checker-rejects-asian-mans-photo-having-eyes/
+
Same
person
or not?
Image
Capture
Attack
Detection
⟶ False accusation
APCER
Missed PA
BPCER False
Assert of PA
⟶ Security hole
⟶ False accusation
Incorrect
detection
No
detection
⟶ Inconvenience
False Assert
Low Q
Figure 1: The figure is intended to show possible stages in a face recognition pipeline at which demographic differentials
could, in principle, arise. Note that none of these stages necessarily includes algorithms that may be labelled artificial
intelligence, though typically the detection and feature extraction modules are AI-based now.
1 Introduction
Over the last two years there has been expanded coverage of face recognition in the popular press. In some
part this is due to the expanded capability of the algorithms, a larger number of applications, lowered barriers
to algorithm development
1
, and, not least, reports that the technology is somehow biased. This latter aspect
is based on Georgetown [14] and two reports by MIT [5, 36]. The Georgetown work noted prior studies [22]
articulated sources of bias, and described the potential impacts particularly in a policing context, and discussed
policy and regulatory implications. The MIT work did not study face recognition, instead it looked at how well
publicly accessible cloud-based estimation algorithms can determine gender from a single image. The studies
have widely cited as evidence that face recognition is biased.
This stems from a confusion in terminology: Face classification algorithms, of the kind MIT reported on, accept
one face image sample and produce an estimate of age, or sex, or some other property of the subject. Face
recognition algorithms, on the other hand, operate as differential operators: They compare identity information
in features vectors extract from two face image samples and produce a measure of similarity between the two,
which can be used to answer the “question same person or not?”. Face algorithms, both one-to-one identity
verification and one-to-many search algorithms, are built on this differential comparison. The salient point, in
the demographic context, is that one or two people are involved in a comparison and, as we will see, the age,
1
Gains in face recognition performance stem from well-capitalized AI research in industry and academic leading to the development of
convolutional neural networks, and open-source implementations thereof (Caffe, Tensorflow etc.). For face recognition the availability of
large numbers of identity-labeled images (from the web, and in the form of web-curated datasets [VGG2, IJB-C]), and the availability of
ever more powerful GPUs has supported training those networks.
Links:
EXEC. SUMMARY
TECH. SUMMARY
False positive: Incorrect association of two subjects 1:1 FMR 1:N FPIR
False negative: Failed association of one subject 1:1 FNMR 1:N FNIR
T 0 → FMR, FPIR → 0
→ FNMR, FNIR → 1

This publication is available free of charge from: https://doi.org/10.6028/NIST.IR.8280
2019/12/19 08:14:00 FRVT - FACE RECOGNITION VENDOR TEST - DEMOGRAPHICS 15
sex, race and other demographic properties of both will be material to the recognition outcome.
The MIT reports nevertheless serve as a cautionary tale in two respects. First, that demographic group member-
ship can have a sizeable effect on algorithms that process face photographs; second, that algorithm capability
varies considerably by developer.
1.1 Potential sources of bias in face recognition systems
Lost in the discussion of bias is specificity on exactly what component of the process is at fault. Accord-
ingly, we introduce Figure 1 to show that a face recognition system is composed of several parts. The figure
shows a notional face recognition pipeline consisting of a capture subsystem, primarily a camera, followed
by a presentation attack detection (PAD) module intended to detect impersonation attempts, a quality accep-
tance (QA) step aimed at checking portrait standard compliance, then the recognition components of feature
extraction and 1:1 or 1:N comparison, the output of which may prompt human involvement. The order of the
components may be different in some systems, for example the QA component may be coupled to the capture
process and would precede PAD. Some components may not exist in some systems, particularly the QA and
PAD functions may not be necessary.
The Figure shows performance metrics, any of which could notionally have a demographic differential. Errors
at one stage will generally have downstream consequences. In a system where subjects make cooperative
presentation to the camera, a person could be rejected in the early stages before recognition itself. For example,
a camera equipped with optics that have too narrow a field of view could produce an image of a tall individual
in which in which the top part of the head was cropped. This could cause rejection at almost any stage and a
system owner would need to determine the origin of errors.
1.2 The role of image quality
Recent research [9] has shown that cameras can have an effect on a generic downstream recognition engine.
A poor image can undermine detection or recognition, and it is possible that certain demographics yield pho-
tographs ill-suited to face recognition e.g. young children [28], or very tall individuals. As pointed out above
there is potential for demographic differentials to appear at the capture stage, that is when only a single im-
age is being collected before any comparison with other images. Demographic differentials that occur during
collection could arise from (at least) inadequacies of the camera, from the environment or “stage”, and from
client-side detection or quality assessment algorithms. Note that manifestly poor (and unrecognizable) images
can be collected from mis-configured cameras, without any algorithmic or AI culpability. Indeed, after publica-
tion of the MIT studies [5,36] on bias in gender-estimation algorithms, suspicion fell upon the presence of poor
Links:
EXEC. SUMMARY
TECH. SUMMARY
False positive: Incorrect association of two subjects 1:1 FMR 1:N FPIR
False negative: Failed association of one subject 1:1 FNMR 1:N FNIR
T 0 → FMR, FPIR → 0
→ FNMR, FNIR → 1

This publication is available free of charge from: https://doi.org/10.6028/NIST.IR.8280
2019/12/19 08:14:00 FRVT - FACE RECOGNITION VENDOR TEST - DEMOGRAPHICS 16
photographs, due to under-exposure of dark-skinned individuals in that dataset. An IBM gender estimation
algorithm had been faulted in the MIT study; in response, and previously, IBM has been active in addressing
AI bias. Relevant here is that it produced a better algorithm
2
, and examined whether skin tone itself drove
gender classification accuracy [30, 31] - in short, “skin type by itself has a minimal effect on the classification
decision”.
False negatives occur in biometric systems when samples from one individual yield a comparison score below
a threshold. This will occur when the features extracted from two input photographs are insufficiently similar.
Recall that face recognition is implemented as a differential operator: two samples are analyzed and compared.
So a false negative occurs when two from the same face appear different to the algorithm.
It is very common to attribute false negatives to factors such as pose, illumination and expression so much so
that dedicated databases have been built up to support development of algorithms with immunity to such
3
.
Invariance to such “nuisance” factors has been the focus of the bulk of face recognition research for more two
decades. Indeed over the last five years there have been great advances in this respect due to the adoption
of deep convolutional neural networks which demonstrate remarkable tolerance to very sub-standard pho-
tographs i.e. those that deviate from formal portrait standards most prominently ISO/IEC 39794-5 and its
law-enforcement equivalent ANSI/NIST ITL 1-2017.
However, here we need to distinguish between factors that are expected to affect one photo in a mated pair -
due to poor photography (e.g. mis-focus), poor illumination (e.g. too dark), and poor presentation (e.g. head
down) - and those that would affect both photographs over time, potentially including properties related to
demographics.
1.3 Photographic Standards
In the late 1990s the FBI asked NIST to establish photographic best-practices for mugshot collection
4
. This
was done to guide primarily state and local police departments in the capture of photographs that would
support forensic (i.e. human) review. It occurred more than a decade before the FBI deployed automated face
recognition. That standardization work was conducted in anticipation of digital cameras
5
being available to
replace film cameras that had been used for almost a century. The standardization work included consideration
of cameras, lights and geometry
6
. There was explicit consideration of the need to capture images of both dark
and light skinned individuals, it being understood that it is relatively easy to produce photographs for which
2
See Mitigating Bias in AI Models.
3
The famous PIE databases, for example.
4
Early documents, such as Best Practice Recommendation for the Capture of Mugshots, 1999, seeded later formal standardization of
ISO/IEC 19794-5.
5
See NIST Interagency Report 6322, 1999.
6
See this overview.
Links:
EXEC. SUMMARY
TECH. SUMMARY
False positive: Incorrect association of two subjects 1:1 FMR 1:N FPIR
False negative: Failed association of one subject 1:1 FNMR 1:N FNIR
T 0 → FMR, FPIR → 0
→ FNMR, FNIR → 1

This publication is available free of charge from: https://doi.org/10.6028/NIST.IR.8280
2019/12/19 08:14:00 FRVT - FACE RECOGNITION VENDOR TEST - DEMOGRAPHICS 17
large areas of dark or bright pixels can render detection of anatomical features impossible.
Face recognition proceeds as a differential operation on features extracted from two photographs. Accuracy
can be undermined by poor photography/illumination/presentation and by differences in those i.e. any
change in the digital facial appearance. Of course an egregiously underexposed photograph will have in-
sufficient information content, but two photographs taken with even moderately poor exposure can match,
and leading contemporary algorithms are highly tolerant of quality degradations.
1.4 Age and ageing
Ageing will change appearance over decades and will ultimately undermine automated face recognition
7
. In
the current study, we don’t consider ageing to be a demographic factor because it is a slow, more-or-less grace-
ful, process that happens to all of us. However, there is at least one demographic group that ages more quickly
than others - children - who are disadvantaged in many automated border control systems either by being
excluded by policy, or by encountering higher false negatives. Age itself is a demographic factor as accuracy
in the elderly and the young differ for face recognition (usually) and also for fingerprint authentication. This
applies even without significant time lapse between two photographs.
Clearly injury or disease can change appearance on very short timescales, so such factors should be excluded,
when possible, from studies dedicated to detection of broad demographic effects. Development of equipment
and algorithms, and studies thereof, that are dedicated to the inclusive use of biometrics are valuable of course
- for example recognition of photosensitive subjects wearing sunglasses, or finger amputees presenting finger-
prints.
7
See recent results for verification algorithms in the FRVT reports, and for identification algorithms in NIST Interagency Report 8271 [17].
For a formal longitudinal analysis of ageing, using mixed-effects models, see Best-Rowden [3].
Links:
EXEC. SUMMARY
TECH. SUMMARY
False positive: Incorrect association of two subjects 1:1 FMR 1:N FPIR
False negative: Failed association of one subject 1:1 FNMR 1:N FNIR
T 0 → FMR, FPIR → 0
→ FNMR, FNIR → 1

This publication is available free of charge from: https://doi.org/10.6028/NIST.IR.8280
2019/12/19 08:14:00 FRVT - FACE RECOGNITION VENDOR TEST - DEMOGRAPHICS 18
# SOURCE IMAGE NUMBER OF DISCUSSION
SUBJECTS IMAGES
1 Cavazos et
al. [8] at UT
Dallas
Notre Dame
GBU [32]
portraits
389 <1085 The study showed order-of-magnitude elevations in false positive rates in
university volunteer Asian vs. Caucasian faces. The study reported FMR(T).
As the study showed neither FNMR(T) nor linked error tradeoff
characteristics the false negative differential is not apparent. It discusses the
effect of “yoking” i.e the pairing of imposters by sex and race. It deprecates
area-under-the-curve (AUC). The study used two related algorithms from
the University of Maryland, one open-source algorithm [38], and one older
inaccurate pre-DCNN algorithm.
2 Krishnapriya
et al. [23] at
Florida
Inst. Tech
Operational
mugshots:
Morph
db [37]
10 350
African
Am. +
2 769
Cau-
casians
42 620
African
Am. +
10 611
Cau-
casians
The study reported: order-of-magnitude elevated false positives in African
Americans vs. Caucasians; lower false negative rates in African Americans;
and reduced differentials in higher quality images [23,24]. That study used
three open-source algorithms, and one commercial algorithm. Two of the
open-source algorithms are quite inaccurate and not representative of
commercial deployment. Importantly, the study also noted the inadequacies
of error tradeoff characteristics for documenting fixed-threshold
demographic differentials.
3 Howard et
al. [20] at
SAIC/MdTF
with DHS
S&T
Lab
collected,
adult
volunteers [9]
363 - The study establish useful definitions for “differential performance“ and
“differential outcome” and for broad and narrow heterogeneity of imposter
distributions. It showed order-of-magnitude variation in false positive rates
with age, sex and race, establishing an information gain approach to
formally ordering their effect. The study employed images from 11 capture
devices, and applied one leading commercial verification algorithm.
Table 2: Prior studies.
2 Prior work
All prior work relates to one-to-one verification algorithms. This report, in contrast, includes results for many
recent, mostly commercial, algorithms implementing both verification and identification.
Except as detailed below, this report is the first to properly report and distinguish between false positive and
false negative effects, something that is often missing in other reports.
The broad effects given in this report concerning age and sex have been known as far back as 2003 [35]. Since
2017, our ongoing FRVT report [16] has reported large false positive differential across sex, age and race.
Tables 2 and 3 summarize recent work in demographic effects in automated face recognition.
Links:
EXEC. SUMMARY
TECH. SUMMARY
False positive: Incorrect association of two subjects 1:1 FMR 1:N FPIR
False negative: Failed association of one subject 1:1 FNMR 1:N FNIR
T 0 → FMR, FPIR → 0
→ FNMR, FNIR → 1

This publication is available free of charge from: https://doi.org/10.6028/NIST.IR.8280
2019/12/19 08:14:00 FRVT - FACE RECOGNITION VENDOR TEST - DEMOGRAPHICS 19
# SOURCE IMAGE NUMBER OF DISCUSSION
SUBJECTS IMAGES
4 Cook et
al. [9] at
SAIC/MdTF
with DHS
S&T
Lab
collected,
adult
volunteers
525 The study deployed mixed-effects regression models to examine
dependence of genuine similarity scores on sex, age, height, eyewear, skin
reflectance and on capture device. The report displayed markedly different
images of the same people from different capture devices, showing potential
for the camera to induce demographic differential performance. The study
found lower similarity scores in those identifying as Black or African
American, comporting with [22] but contrary to the best ageing study [3].
The study also showed that comparison of samples collected on the same
day have different demographic differentials than those collected up to four
years apart, in particular that women give lower genuine scores than men
with time separation. Same-day biometrics are useful for short-term
recognition applications like transit through an airport.
5 El Khiyari
et al. [13]
Operational
mugshots:
Morph
db [37]
724 adult,
balanced
on race +
sex
2896 =
1448 each
African
Am. +
Cau-
casians,
balanced
on sex
The paper used a subset of the MORPH database with two algorithms( [38],
modified and one COTS) to show better verification error rates in the men,
the elderly, and in whites. The study should be discounted for two reasons:
First the algorithms give high error rates at very modest false match rates:
the best FNMR = 0.06 at FMR = 0.01. Second the paper reports FNMR at
fixed FMR, not at fixed thresholds thereby burying FMR differentials.
Moreover, the paper does not disclose how imposters were paired e.g.
randomly or, say, with same age, race, and sex.
Table 3: Prior studies (continued).
Links:
EXEC. SUMMARY
TECH. SUMMARY
False positive: Incorrect association of two subjects 1:1 FMR 1:N FPIR
False negative: Failed association of one subject 1:1 FNMR 1:N FNIR
T 0 → FMR, FPIR → 0
→ FNMR, FNIR → 1

This publication is available free of charge from: https://doi.org/10.6028/NIST.IR.8280
2019/12/19 08:14:00 FRVT - FACE RECOGNITION VENDOR TEST - DEMOGRAPHICS 20
3 Performance metrics
Both verification and identification systems generally commit two kinds of errors, the so-called Type I error
where an individual is incorrectly associated with another, and Type II where the individual is incorrectly not
associated with themselves.
The ISO/IEC 19795-1 performance testing and reporting standard requires different metrics to be reported
for identification and verification implementations. Accordingly the following subsections define the formal
metrics used throughout this document.
3.1 Verification metrics
Verification accuracy is estimated by forming two sets of scores: Genuine scores are produced from mated
pairs; imposter scores are produced from non-mated pairs. These comparisons should be done in random
order so that the algorithm under test cannot infer that a comparison is mated or not.
From a vector of N genuine scores, u, the false non-match rate (FNMR) is computed as the proportion below
some threshold, T:
FNMR(T ) = 1 −
1
N
N
X
i=1
H(u
i
− T ) (1)
where H(x) is the unit step function, and H(0) taken to be 1.
Similarly, given a vector of M imposter scores, v, the false match rate (FMR) is computed as the proportion
above T:
FMR(T ) =
1
M
M
X
i=1
H(v
i
− T ) (2)
The threshold, T, can take on any value. We typically generate a set of thresholds from quantiles of the observed
imposter scores, v, as follows. Given some interesting false match rate range, [FMR
L
, FMR
U
], we form a vector
of K thresholds corresponding to FMR measurements evenly spaced on a logarithmic scale. This supports
plotting of FMR on a logarithmic axis. This is done because typical operations target false match rates spanning
several decades 10
−6
to as high as 10
−2
.
T
k
= Q
v
(1 − FMR
k
) (3)
where Q
v
is the quantile function, and FMR
k
comes from
log
10
FMR
k
= log
10
FMR
L
+
k
K
[log
10
FMR
U
− log
10
FMR
L
] (4)
Links:
EXEC. SUMMARY
TECH. SUMMARY
False positive: Incorrect association of two subjects 1:1 FMR 1:N FPIR
False negative: Failed association of one subject 1:1 FNMR 1:N FNIR
T 0 → FMR, FPIR → 0
→ FNMR, FNIR → 1

This publication is available free of charge from: https://doi.org/10.6028/NIST.IR.8280
2019/12/19 08:14:00 FRVT - FACE RECOGNITION VENDOR TEST - DEMOGRAPHICS 21
Error tradeoff characteristics are plots of FNMR(T) vs. FMR(T). These are plotted with FMR
U
→ 1 and FMR
L
as low as is sustained by the number of imposter comparisons, M. This should be somewhat higher than the
“rule of three” limit 3/N because samples are generally not independent due to the use of the same image in
multiple comparisons.
3.2 Identification metrics
Identification accuracy is estimated from two sets of candidate lists: First, a set of candidate lists obtained from
mated-searches; second, a set from non-mated searches. These searches should not be conducted by randomly
ordering mated and non-mated searches so that the algorithm under test cannot infer that a search has a mate
or not. Tests of open-set biometric identification algorithms must quantify frequency of two error conditions:
False positives: Type I errors occur when search data from a person who has never been seen before is
incorrectly associated with one or more enrollees’ data.
Misses: Type II errors arise when a search of an enrolled person’s biometric does not return the correct
identity.
Many practitioners prefer to talk about “hit rates” instead of “miss rates” - the first is simply one minus the
other as detailed below. Sections 3.2.1 and 3.2.2 define metrics for the Type I and Type II performance variables.
Additionally, because recognition algorithms sometimes fail to produce a template from an image, or fail to
execute a one-to-many search, the occurrence of such events must be recorded. Further because algorithms
might elect to not produce a template from, for example, a poor quality image, these failure rates must be
combined with the recognition error rates to support algorithm comparison. This is addressed in section 3.4.
3.2.1 Quantifying false positives
It is typical for a search to be conducted into an enrolled population of N identities, and for the algorithm
to be configured to return the closest L candidate identities. These candidates are ranked by their score, in
descending order, with all scores required to be greater than or equal to zero. A human analyst might examine
either all L candidates, or just the top R ≤ L identities, or only those with score greater than threshold, T.
From the candidate lists, we compute false positive identification rate as the proportion of non-mate searches
that erroneously return candidates:
FPIR(N, T ) =
Num. non-mate searches with one or more candidates returned with score at or above threshold
Num. non-mate searches attempted.
(5)
Links:
EXEC. SUMMARY
TECH. SUMMARY
False positive: Incorrect association of two subjects 1:1 FMR 1:N FPIR
False negative: Failed association of one subject 1:1 FNMR 1:N FNIR
T 0 → FMR, FPIR → 0
→ FNMR, FNIR → 1

This publication is available free of charge from: https://doi.org/10.6028/NIST.IR.8280
2019/12/19 08:14:00 FRVT - FACE RECOGNITION VENDOR TEST - DEMOGRAPHICS 22
Under this definition, FPIR can be computed from the highest non-mate candidate produced in a search - it
is not necessary to consider candidates at rank 2 and above. An alternative quantity, selectivity, accounts for
multiple candidates above threshold - see [17].
3.2.2 Quantifying hits and misses
If L candidates are returned in a search, a shorter candidate list can be prepared by taking the top R ≤ L candi-
dates for which the score is above some threshold, T ≥ 0. This reduction of the candidate list is done because
thresholds may be applied, and only short lists might be reviewed (according to policy or labor availability, for
example). It is useful then to state accuracy in terms of R and T , so we define a “miss rate” with the general
name false negative identification rate (FNIR), as follows:
FNIR(N, R, T ) =
Num. mate searches with enrolled mate found outside top R ranks or score below threshold
Num. mate searches attempted.
(6)
This formulation is simple for evaluation in that it does not distinguish between causes of misses. Thus a mate
that is not reported on a candidate list is treated the same as a miss arising from face finding failure, algorithm
intolerance of poor quality, or software crashes. Thus if the algorithm fails to produce a candidate list, either
because the search failed, or because a search template was not made, the result is regarded as a miss, adding
to FNIR.
Hit rates, and true positive identification rates: While FNIR states the “miss rate” as how often the correct candidate
is either not above threshold or not at good rank, many communities prefer to talk of “hit rates”. This is simply
the true positive identification rate(TPIR) which is the complement of FNIR giving a positive statement of how
often mated searches are successful:
TPIR(N, R, T ) = 1 − FNIR(N, R, T ) (7)
This report does not report true positive “hit” rates, preferring false negative miss rates for two reasons. First,
costs rise linearly with error rates. For example, if we double FNIR in an access control system, then we
double user inconvenience and delay. If we express that as decrease of TPIR from, say 98.5% to 97%, then we
mentally have to invert the scale to see a doubling in costs. More subtly, readers don’t perceive differences
in numbers near 100% well, becoming inured to the “high nineties” effect where numbers close to 100 are
perceived indifferently.
Reliability is a corresponding term, typically being identical to TPIR, and often cited in automated (fingerprint)
identification system (AFIS) evaluations.
Links:
EXEC. SUMMARY
TECH. SUMMARY
False positive: Incorrect association of two subjects 1:1 FMR 1:N FPIR
False negative: Failed association of one subject 1:1 FNMR 1:N FNIR
T 0 → FMR, FPIR → 0
→ FNMR, FNIR → 1

This publication is available free of charge from: https://doi.org/10.6028/NIST.IR.8280
2019/12/19 08:14:00 FRVT - FACE RECOGNITION VENDOR TEST - DEMOGRAPHICS 23
An important special case is the cumulative match characteristic(CMC) which summarizes accuracy of mated-
searches only. It ignores similarity scores by relaxing the threshold requirement, and just reports the fraction
of mated searches returning the mate at rank R or better.
CMC(N, R) = 1 − FNIR(N, R, 0) (8)
We primarily cite the complement of this quantity, FNIR(N, R, 0), the fraction of mates not in the top R ranks.
The rank one hit rate is the fraction of mated searches yielding the correct candidate at best rank, i.e. CMC(N,
1). While this quantity is the most common summary indicator of an algorithm’s efficacy, it is not dependent
on similarity scores, so it does not distinguish between strong (high scoring) and weak hits. It also ignores that
an adjudicating reviewer is often willing to look at many candidates.
3.3 DET interpretation
In biometrics, a false negative occurs when an algorithm fails to match two samples of one person − a Type II
error. Correspondingly, a false positive occurs when samples from two persons are improperly associated − a
Type I error.
Matches are declared by a biometric system when the native comparison score from the recognition algorithm
meets some threshold. Comparison scores can be either similarity scores, in which case higher values indicate
that the samples are more likely to come from the same person, or dissimilarity scores, in which case higher
values indicate different people. Similarity scores are traditionally computed by fingerprint and face recog-
nition algorithms, while dissimilarities are used in iris recognition. In some cases, the dissimilarity score is a
distance possessing metric properties. In any case, scores can be either mate scores, coming from a comparison
of one person’s samples, or nonmate scores, coming from comparison of different persons samples.
The words “genuine” or “authentic” are synonyms for mate, and the word “imposters”” is used as a synonym
for nonmate. The words “mate” and “nonmate” are traditionally used in identification applications (such as
law enforcement search, or background checks) while genuine and imposter are used in verification applica-
tions (such as access control).
An error tradeoff characteristic represents the tradeoff between Type II and Type I classification errors. For
identification this plots false negative vs. false positive identification rates i.e. FNIR vs. FPIR parametrically
with T. Such plots are often called detection error tradeoff (DET) characteristics or receiver operating charac-
teristic (ROC). These serve the same function − to show error tradeoff − but differ, for example, in plotting
the complement of an error rate (e.g. TPIR = 1 − FNIR) and in transforming the axes, most commonly using
logarithms, to show multiple decades of FPIR.
Links:
EXEC. SUMMARY
TECH. SUMMARY
False positive: Incorrect association of two subjects 1:1 FMR 1:N FPIR
False negative: Failed association of one subject 1:1 FNMR 1:N FNIR
T 0 → FMR, FPIR → 0
→ FNMR, FNIR → 1

This publication is available free of charge from: https://doi.org/10.6028/NIST.IR.8280
2019/12/19 08:14:00 FRVT - FACE RECOGNITION VENDOR TEST - DEMOGRAPHICS 24
3.4 Failure to extract features
During enrollment some algorithms fail to convert a face image to a template. The proportion of failures is
the failure-to-enroll rate, denoted by FTE. Similarly, some search images are not converted to templates. The
corresponding proportion is termed failure-to-extract, denoted by FTX. We do not report FTX because we
assume that the same underlying algorithm is used for template generation for enrollment and search.
In verification, we do not need to explicitly include failure to extract rates into the FNMR and FMR accuracy
statements, because we regard any comparison that involves an image for which a failure-to-extract occurred
as producing a zero similarity score. This increases FNMR and decreases FMR. Gaming opportunities that
theoretically arise from this treatment of FMR are generally not of concern because the algorithm under test
does not know whether any given image will be used in genuine comparisons, imposter comparisons or both.
For identification, we similarly incorporate failure-to-extract events into FNIR and FPIR measurements as fol-
lows.
Enrollment templates: Any failed enrollment is regarded as producing a zero length template. Algo-
rithms are required by the API [18] to transparently process zero length templates. The effect of template
generation failure on search accuracy depends on whether subsequent searches are mated, or non-mated:
Mated searches will fail giving elevated FNIR; non-mated searches will not produce false positives so, to
first order, FPIR will be reduced by a factor of 1−FTE.
Search templates and 1:N search: In cases where the algorithm fails to produce a search template from
input imagery, the result is taken to be a candidate list whose entries have no hypothesized identities and
zero score. The effect of template generation failure on search accuracy depends on whether searches
are mated, or non-mated: Mated searches will fail giving elevated FNIR; Non-mated searches will not
produce false positives, so FPIR will be reduced.
This approach is the correct treatment for positive-identification applications such as access control where co-
operative users are enrolled and make attempts at recognition. This approach is not appropriate to negative
identification applications, such as visa fraud detection, in which hostile individuals may attempt to evade de-
tection by submitting poor quality samples. In those cases, template generation failures should be investigated
as though a false alarm had occurred.
Links:
EXEC. SUMMARY
TECH. SUMMARY
False positive: Incorrect association of two subjects 1:1 FMR 1:N FPIR
False negative: Failed association of one subject 1:1 FNMR 1:N FNIR
T 0 → FMR, FPIR → 0
→ FNMR, FNIR → 1

This publication is available free of charge from: https://doi.org/10.6028/NIST.IR.8280
2019/12/19 08:14:00 FRVT - FACE RECOGNITION VENDOR TEST - DEMOGRAPHICS 25
Developer Verification algorithms Identification algorithms
1 3Divi 3divi-003 3divi-004 3divi-0 3divi-3
2 Adera Global PTE Ltd adera-001
3 Alchera Inc alchera-000 alchera-001 alchera-0
4 Alivia / Innovation Sys isystems-001 isystems-002 isystems-0 isystems-3
5 AllGoVision allgovision-000 allgovision-000
6 AlphaSSTG alphaface-001
7 Amplified Group amplifiedgroup-001
8 Anke Investments anke-004 anke-0 anke-002
9 AnyVision anyvision-002 anyvision-004
10 Aware aware-003 aware-004 aware-0 aware-3
11 Awidit Systems awiros-001
12 Ayonix ayonix-000 ayonix-0
13 Beijing Vion Technology Inc vion-000
14 Bitmain bm-001
15 CSA IntelliCloud Technology intellicloudai-001
16 CTBC Bank Co Ltd ctbcbank-000
17 Camvi Technologies camvi-002 camvi-004 camvi-1 camvi-3 camvi-4
18 China Electronics Import-Export
Corp
ceiec-001 ceiec-002
19 China University of Petroleum upc-001
20 Chunghwa Telecom Co. Ltd chtface-001
21 Cognitec Systems GmbH cognitec-000 cognitec-001 cognitec-0 cognitec-2
22 Cyberextruder cyberextruder-001 cyberextruder-002
23 Cyberlink Corp cyberlink-002 cyberlink-003
24 DSK dsk-000
25 Dahua Technology Co Ltd dahua-002 dahua-003 dahua-0 dahua-1 dahua-002
26 Deepglint deepglint-001 deepglint-001
27 Dermalog dermalog-005 dermalog-006 dermalog-0 dermalog-5 dermalog-6
28 DiDi ChuXing Technology Co didiglobalface-001
29 Digital Barriers digitalbarriers-002
30 Eyedea Recognition eyedea-0 eyedea-3
31 FaceSoft Ltd facesoft-000
32 FarBar Inc f8-001 f8-001
33 Gemalto Cogent cogent-003 cogent-004
34 Glory Ltd glory-001 glory-0
35 Gorilla Technology gorilla-003 gorilla-0
36 Guangzhou Pixel Solutions Co
Ltd
pixelall-002 pixelall-002
37 Hengrui AI Technology Ltd hr-001 hr-002
38 Hikvision Research Institute hik-001 hik-0 hik-5
39 ID3 Technology id3-003 id3-004
40 ITMO University itmo-005 itmo-006
41 Idemia idemia-004 idemia-005 idemia-0 idemia-4 idemia-5
42 Imagus Technology Pty Ltd imagus-000 imagus-0
43 Imperial College London imperial-000 imperial-002 imperial-000
44 Incode Technologies Inc incode-004 incode-0 incode-004
Table 4: Algorithms evaluated in this report.
Links:
EXEC. SUMMARY
TECH. SUMMARY
False positive: Incorrect association of two subjects 1:1 FMR 1:N FPIR
False negative: Failed association of one subject 1:1 FNMR 1:N FNIR
T 0 → FMR, FPIR → 0
→ FNMR, FNIR → 1

This publication is available free of charge from: https://doi.org/10.6028/NIST.IR.8280
2019/12/19 08:14:00 FRVT - FACE RECOGNITION VENDOR TEST - DEMOGRAPHICS 26
Developer Verification algorithms Identification algorithms
45 Innovatrics innovatrics-004 innovatrics-006 innovatrics-0
46 Institute of Information
Technologies
iit-001
47 Intel Research Group intelresearch-000
48 Intellivision intellivision-001 intellivision-002
49 Is It You isityou-000
50 Kakao Corp kakao-001 kakao-002
51 Kedacom International Pte kedacom-000 kedacom-001
52 Kneron Inc kneron-003
53 Lomonosov Moscow State
University
intsysmsu-000 intsysmsu-000
54 Lookman Electroplast Industries lookman-002 lookman-004
55 Megvii/Face++ megvii-001 megvii-002 megvii-0 megvii-1
56 MicroFocus microfocus-002 microfocus-001 microfocus-0
57 Microsoft microsoft-0 microsoft-5
58 Momentum Digital Co Ltd sertis-000
59 Moontime Smart Technology mt-000
60 N-Tech Lab ntechlab-006 ntechlab-007 ntechlab-0 ntechlab-6 ntechlab-007
61 NEC nec-2 nec-3
62 Neurotechnology neurotechnology-005
neurotechnology-006
neurotechnology-0 neurotechnology-5
neurotechnology-007
63 Nodeflux nodeflux-001 nodeflux-002
64 NotionTag Technologies Private
Limited
notiontag-000
65 Panasonic R+D Center Singapore psl-002 psl-003
66 Paravision (EverAI) everai-paravision-003 paravision-004 everai-0 everai-3 everai-paravision-004
67 Rank One Computing rankone-007 rankone-0 rankone-5 rankone-006 rankone-007
68 Realnetworks Inc realnetworks-002 realnetworks-003 realnetworks-0 realnetworks-2 realnetworks-003
69 Remark Holdings remarkai-001 remarkai-0 remarkai-000
70 Rokid Corporation Ltd rokid-000
71 Saffe Ltd saffe-001 saffe-002
72 Sensetime Group Ltd sensetime-002 sensetime-0 sensetime-1 sensetime-002
73 Shaman Software shaman-000 shaman-001 shaman-0
74 Shanghai Jiao Tong University sjtu-001
75 Shanghai Ulucu Electronics
Technology Co. Ltd
uluface-002
76 Shanghai Universiy - Shanghai
Film Academy
shu-001
77 Shanghai Yitu Technology yitu-003 yitu-0 yitu-4 yitu-5
78 Shenzhen EI Networks Limited einetworks-000
79 Shenzhen Inst Adv Integrated
Tech CAS
siat-004 siat-002 siat-0
80 Shenzhen Intellifusion
Technologies Co Ltd
intellifusion-001
81 Smilart smilart-002 smilart-003 smilart-0
82 Star Hybrid Limited starhybrid-001
83 Synesis synesis-005 synesis-0
84 Tech5 SA tech5-002 tech5-003 tech5-001
85 Tencent Deepsea Lab deepsea-001 deepsea-001
86 Tevian tevian-004 tevian-005 tevian-0 tevian-4
87 Thales cogent-0 cogent-3
88 TigerIT Americas LLC tiger-002 tiger-003 tiger-0
Table 5: Algorithms evaluated in this report.
Links:
EXEC. SUMMARY
TECH. SUMMARY
False positive: Incorrect association of two subjects 1:1 FMR 1:N FPIR
False negative: Failed association of one subject 1:1 FNMR 1:N FNIR
T 0 → FMR, FPIR → 0
→ FNMR, FNIR → 1

This publication is available free of charge from: https://doi.org/10.6028/NIST.IR.8280
2019/12/19 08:14:00 FRVT - FACE RECOGNITION VENDOR TEST - DEMOGRAPHICS 27
Developer Verification algorithms Identification algorithms
89 TongYi Transportation
Technology
tongyi-005
90 Toshiba toshiba-002 toshiba-003 toshiba-0 toshiba-1
91 Trueface.ai trueface-000
92 ULSee Inc ulsee-001
93 Veridas Digital Authentication
Solutions S.L.
veridas-002
94 Via Technologies Inc. via-000
95 Videonetics Technology Pvt Ltd videonetics-001
96 Vigilant Solutions vigilantsolutions-006
vigilantsolutions-007
vigilantsolutions-0
97 Visidon vd-001 vd-0
98 Vision-Box visionbox-000 visionbox-001
99 VisionLabs visionlabs-006 visionlabs-007 visionlabs-7 visionlabs-008
100 Vocord vocord-006 vocord-007 vocord-0 vocord-3
101 Winsense Co Ltd winsense-000
102 X-Laboratory x-laboratory-000
103 Xiamen Meiya Pico Information
Co. Ltd
meiya-001
104 Zhuhai Yisheng Electronics
Technology
yisheng-004 yisheng-0
105 iQIYI Inc iqface-000
106 iSAP Solution Corporation isap-001
Table 6: Algorithms evaluated in this report.
Links:
EXEC. SUMMARY
TECH. SUMMARY
False positive: Incorrect association of two subjects 1:1 FMR 1:N FPIR
False negative: Failed association of one subject 1:1 FNMR 1:N FNIR
T 0 → FMR, FPIR → 0
→ FNMR, FNIR → 1

This publication is available free of charge from: https://doi.org/10.6028/NIST.IR.8280
2019/12/19 08:14:00 FRVT - FACE RECOGNITION VENDOR TEST - DEMOGRAPHICS 28
4 False positive differentials in verification
False positives occur in biometric systems when samples from two individuals yield a comparison score at or
above a set threshold. Most systems are configured with a threshold that is fixed for all users. False positives
present a security hazard to one-to-one verification applications. They have similarly serious consequences in
one-to-many identification applications. For example, in applications where subjects apply for some benefit
more than once under different biographic identities e.g. visa-shopping, driving license issuance, benefits
fraud, an otherwise undetected false positive might lead to various downstream consequences such a financial
loss. In a surveillance application a false positive may lead to a false accusation.
This section gives empirical quantification of the variation in verification false match rates across demograph-
ics. We present results for one-to-many identification later in section 7.
We conduct several experiments with images drawn from both domestic United States and worldwide popu-
lations.
1. One-to-one application photo cross comparison, by age, sex, country-of-birth.
2. One-to-one mugshot cross comparison by age, sex, and race.
3. One-to-one visa photo cross comparison by age.
4.1 Metrics
The metrics appropriate to verification have been detailed in section 3.1. These are related to particular appli-
cations in Figure 2. The discussion in subsequent sections centers on false match rates at particular thresholds,
i.e. FMR(T ).
4.2 False match rates under demographic pairing
It is necessary in many biometric tests to estimate false match rates. This is done by executing imposter com-
parisons, and measuring false positive outcomes at some threshold(s). Historically biometric evaluations gen-
erated imposter comparisons by randomly pairing individuals, or by exhaustively comparing all individuals.
As we will show in this section, this practice is inappropriate for evaluation of face recognition algorithms as it
underestimates false match rates that would occur in practice. The random pairing of imposters is sometimes
referred to as zero-effort pairing, mean that no effort is expended by an imposter to look like the target of the
recognition attempt.
Links:
EXEC. SUMMARY
TECH. SUMMARY
False positive: Incorrect association of two subjects 1:1 FMR 1:N FPIR
False negative: Failed association of one subject 1:1 FNMR 1:N FNIR
T 0 → FMR, FPIR → 0
→ FNMR, FNIR → 1

This publication is available free of charge from: https://doi.org/10.6028/NIST.IR.8280
2019/12/19 08:14:00 FRVT - FACE RECOGNITION VENDOR TEST - DEMOGRAPHICS 29
Detection and
localization
Comparison
Algorithm
Automated
face
recognition
engine
evaluated as
black box.
This grey box
is the scope of
NIST’s
evaluation.
Search Photo
The enrollment
sample, often
not in a
database (e.g.
on a phone) or
selected from
a database by
an explicit
biographic
claim of a
identity
The algorithm
is given the
image
Feature extraction
e.g. CNN model
#
Output
Provided to
1
Score
System logs
2
Decision
User
Output is a
similarity score, S
Access Control
Non
-repudiation
Role
Afford access of a person to a physical or logical
resource.
Record the presence of a specific individual
Example
Door unlock.
Phone unlock.
Refutation of a claim by a pharmacist that they did
not dispense a particular drug, or an employer that
an employee did not arrive for work.
Claim of identity
Explicit claim with an identity token such as a phone,
passport or ID card.
Claim with a prior login to a system.
Threshold
High, to limit false positives
Moderate, to prevent confederates using system
Result
Acceptance decision Y/N.
Logged verification decision
Human role
Adjudicate failed rejections, to determine a false
rejection, or detect an actual impostor attempt
Retrieve records to resolve a dispute
Intended human
involvement frequency
Rare
– approx. the false rejection rate identification
rate plus prior probability of an actual mate
Rare
–
approx. the fraud rate multiplied by the false
positive rate
Performance metric of
interest
FNMR at low FMR. See sec. 3.1, 3.2 and Tables 10, 19
FNMR at moderate FMR.
Reference
Photo
Feature extraction
e.g. CNN model
NIST reports accuracy over the entire range of an
algorithms’ possible threshold values. This
sweeps FMR over a range such as [0.000001, 1].
Threshold, T, fixed by system policy, value from
prior calibration, usually vendor-specified
S ≷ T
Figure 2: Verification applications and relevant metrics.
Links:
EXEC. SUMMARY
TECH. SUMMARY
False positive: Incorrect association of two subjects 1:1 FMR 1:N FPIR
False negative: Failed association of one subject 1:1 FNMR 1:N FNIR
T 0 → FMR, FPIR → 0
→ FNMR, FNIR → 1

This publication is available free of charge from: https://doi.org/10.6028/NIST.IR.8280
2019/12/19 08:14:00 FRVT - FACE RECOGNITION VENDOR TEST - DEMOGRAPHICS 30
0. Zero effort
1. Same sex
2. Same age
3. Same sex and age
4. Same country
5. Same country and sex
6. Same country and age
7. Same country, sex, and age
1e−06
2e−06
3e−06
6e−06
1e−05
2e−05
3e−05
6e−05
1e−04
2e−04
3e−04
6e−04
1e−03
2e−03
3e−03
6e−03
1e−02
2e−02
3e−02
6e−02
1e−01
FMR
How impostors are paired
reports/11/figures/dhs_obim/cross_country/impostors/fmr_same_same_same/imperial_002.pdf
Figure 3: For application photos, the figure shows growth in one-to-one verification false match rates as the imposter
demographic pairings are made more similar. At each level the point shows the mean FMR over all countries, age groups,
and sexes. For example, in the second row “6. Same country and age” the mean is taken over 24 within-country times 5
within age-group times 4 within and cross sex FMR estimates, i.e. 480 FMR values. The blue line spans the 5-th to 95-th
percentiles of the FMR estimates. The vertical line shows a nominal FMR value of 0.00003 obtained by setting the threshold
on randomly associated i.e. zero-effort pairs of mugshot images.
Method: We used each verification algorithm to compare 442 019 application images with a disjoint set of
441 517 other application images. The two sets are subject-disjoint. The subjects were born in 24 countries.
This produced 195 billion imposter scores. The images are described in Annex 2 .
The red point in the plot shows the mean of false match rates over particular sets of demographic groups.
Row 7: The uppermost point corresponds to the mean over 240 FMR estimates, namely those comparing
each of two sexes with each other, in each of five age-groups, and within each of 24 countries (2 x 5 x 24
= 240).
Row 6: As row 7, but the average is over 480 FMR estimates that now includes different sex FMR esti-
mates also.
Row 5: As row 7, but now the average is over 1200 FMR estimates that additionally includes all cross-age
group imposter scores.
Row 4: As row 7, but now the average is over 2400 FMR estimates that additionally includes all cross-age
and cross-sex imposter scores.
Row 3: The average is over 5760 FMR estimates that includes 24
2
cross-country comparisons within each
sex and age group.
Row 2: The average is over 11520 FMR estimates now including different sex FMR estimates also.
Links:
EXEC. SUMMARY
TECH. SUMMARY
False positive: Incorrect association of two subjects 1:1 FMR 1:N FPIR
False negative: Failed association of one subject 1:1 FNMR 1:N FNIR
T 0 → FMR, FPIR → 0
→ FNMR, FNIR → 1

This publication is available free of charge from: https://doi.org/10.6028/NIST.IR.8280
2019/12/19 08:14:00 FRVT - FACE RECOGNITION VENDOR TEST - DEMOGRAPHICS 31
Row 1: The average is over 28880 FMR estimates now including five different within-age FMR estimates
also.
Row 0: The average is over 57600 FMR estimates reflecting within- and between-group estimates for 24
countries, 5 age groups and 2 sexes (24
2
.5
2
.2
2
).
The ordering of these rows is hand-crafted. Evaluators at DHS’ Maryland Test Facility developed [20] a formal
approach to showing the most influential pairing factor by quantifying information gained about FMR by
having knowledge of the demographic factors, age, sex and race.
The figure shows how false match rates increase when imposters are drawn from increasingly similar demo-
graphics. This shows that fully zero-effort imposter pairings understate false match rates relative to the situ-
ation of a slightly more active imposters who would chose to present (stolen) credentials from subjects of the
same sex, age and ethnicity. The practice of using zero-effort imposter pairings in tests, we think, stems from
tests of fingerprint algorithm that use where friction ridge structure, particularly minutiae point arrangements,
that are thought to be a developmental trait without clear genetic influence
8
Note that our analysis has not so far documented whether particular demographic groups give higher false
match rates. To address this question we introduce Figure 4 which shows results similar to those above but
now for each specific country of birth.
We make the following observations:
Restricted pairing increases FMR: Within each country, there is a more than order of magnitude increase
in FMR between the zero-effort pair anyone-with-anyone setting, and the same-age, same-sex, same-
country pairing. This re-iterates the results of the previous section, and shows it applies globally.
Country-of-birth matters: For many of the different levels of demographic pairing there is between one
and two orders of magnitude between the 24 countries represented in this dataset. For example when
imposters are from the same sex and country but of any age, the algorithm gives FMR of 0.000046 on
Polish faces and 0.0024 on Vietnamese, a fifty fold increase.
Regions with highest and lowest FMR: Across algorithms often the lowest FMR is observed in Eastern
European populations and the highest in East Asian populations. However there are important excep-
tions: Some algorithms developed in East Asia tend to give lower FMR in photos of subjects born in
East Asian countries
9
. This observation and the topic of demographic differentials associated with na-
8
Genetic influence on friction ridge structure is known: The absence of the SMARCAD1 gene leads to absence of fingerprints at birth.
Further, the distance between friction ridges is smaller, on average in women than in men, and this may well be under genetic influence.
The distance itself is likely not used as a biometric feature, at least not explicitly. Fingerprint pattern classes (arch, whorl etc.), however,
have been shown to have regional (geographic) variations, and these were, at least historically, used in one-to-many multi-finger search
strategies.
9
See, for example, the figure in Annex 8 for algorithms from HIK, Dahua, Yitu, Alphaface, Deepsea Tencent, Toshiba.
Links:
EXEC. SUMMARY
TECH. SUMMARY
False positive: Incorrect association of two subjects 1:1 FMR 1:N FPIR
False negative: Failed association of one subject 1:1 FNMR 1:N FNIR
T 0 → FMR, FPIR → 0
→ FNMR, FNIR → 1

This publication is available free of charge from: https://doi.org/10.6028/NIST.IR.8280
2019/12/19 08:14:00 FRVT - FACE RECOGNITION VENDOR TEST - DEMOGRAPHICS 32
tional origin are covered more completely in the next section which includes results for comparison of
individuals within and across national boundaries.
Discussion: The results above show that false match rates for imposter pairings in likely real-world scenarios
are much higher than those from measured when imposters are paired with zero-effort. For this reason NIST
has been reporting “matched-covariate” accuracy results in its FRVT evaluation of face verification algorithms
[16]. Along similar lines the Australian Department of Foreign Affairs and Trade in tests it sponsors only uses
same-sex imposter pairings. The effect of this is to raise thresholds, and thereby raise false non-march rates
also. Thresholds increase because they are determined from non-mate scores, s, via the quantile function Q, as
that value, T , which gives a proportion, FMR, at or above threshold:
T = Q(s, 1 − FMR) (9)
and the set of demographically matched scores is smaller than if all possible comparisons is used.
Links:
EXEC. SUMMARY
TECH. SUMMARY
False positive: Incorrect association of two subjects 1:1 FMR 1:N FPIR
False negative: Failed association of one subject 1:1 FNMR 1:N FNIR
T 0 → FMR, FPIR → 0
→ FNMR, FNIR → 1

This publication is available free of charge from: https://doi.org/10.6028/NIST.IR.8280
2019/12/19 08:14:00 FRVT - FACE RECOGNITION VENDOR TEST - DEMOGRAPHICS 33
−5.81
−5.63
−5.67
−5.49
−4.74
−4.55
−4.58
−4.39
−4.07
−4.11
−3.79
−3.59
−3.26
−3.30
−2.98
−2.75
−5.70
−5.57
−5.46
−5.34
−4.59
−4.47
−4.30
−4.17
−3.96
−3.89
−3.67
−2.99
−2.82
−2.71
−2.54
−2.80
−5.82
−5.72
−5.74
−5.63
−4.61
−4.49
−4.50
−4.39
−4.19
−4.10
−3.90
−3.45
−3.30
−3.16
−3.01
−2.85
−5.86
−5.72
−5.72
−5.55
−4.72
−4.57
−4.57
−4.41
−4.14
−4.13
−3.85
−3.62
−3.32
−3.34
−3.03
−2.80
−6.00
−6.00
−6.00
−5.84
−5.02
−4.84
−4.78
−4.59
−4.29
−4.30
−4.00
−3.65
−3.35
−3.36
−3.07
−2.83
−6.00
−6.00
−6.00
−6.00
−5.18
−5.00
−5.00
−4.82
−4.54
−4.53
−4.24
−3.86
−3.59
−3.57
−3.30
−3.14
−6.00
−6.00
−6.00
−6.00
−5.24
−5.06
−5.04
−4.85
−4.54
−4.55
−4.25
−3.87
−3.55
−3.57
−3.25
−3.25
−5.62
−5.44
−5.55
−5.37
−4.39
−4.21
−4.24
−4.05
−3.77
−3.78
−3.49
−3.10
−2.84
−2.89
−2.66
−2.57
−5.98
−5.83
−5.91
−5.75
−4.87
−4.71
−4.79
−4.62
−4.35
−4.34
−4.06
−4.01
−3.71
−3.73
−3.43
−3.00
−5.55
−5.46
−5.49
−5.39
−4.59
−4.48
−4.53
−4.41
−4.21
−4.13
−3.93
−3.47
−3.29
−3.20
−3.01
−2.89
−5.52
−5.34
−5.33
−5.14
−4.43
−4.24
−4.23
−4.04
−3.72
−3.75
−3.44
−3.16
−2.82
−2.87
−2.54
−2.41
−5.80
−5.68
−5.76
−5.64
−4.59
−4.46
−4.55
−4.42
−4.21
−4.14
−3.92
−3.56
−3.38
−3.28
−3.10
−2.87
−5.92
−5.75
−5.71
−5.55
−4.82
−4.63
−4.64
−4.45
−4.14
−4.17
−3.86
−3.61
−3.28
−3.32
−3.00
−2.88
−5.87
−5.75
−5.74
−5.62
−4.71
−4.57
−4.56
−4.42
−4.20
−4.13
−3.91
−3.58
−3.39
−3.29
−3.10
−2.82
−5.90
−5.74
−5.85
−5.70
−4.74
−4.57
−4.68
−4.51
−4.24
−4.23
−3.95
−3.77
−3.51
−3.49
−3.23
−2.99
−5.46
−5.26
−5.27
−5.07
−4.39
−4.21
−4.21
−4.02
−3.72
−3.74
−3.44
−3.18
−2.86
−2.90
−2.58
−2.34
−6.00
−6.00
−6.00
−5.96
−4.97
−4.80
−4.79
−4.62
−4.36
−4.33
−4.07
−3.75
−3.52
−3.46
−3.23
−2.87
−6.00
−6.00
−6.00
−6.00
−5.89
−5.69
−5.73
−5.52
−5.22
−5.24
−4.93
−4.64
−4.34
−4.36
−4.06
−3.77
−6.00
−6.00
−6.00
−6.00
−5.53
−5.35
−5.49
−5.30
−5.03
−5.02
−4.75
−4.70
−4.45
−4.45
−4.21
−3.56
−5.27
−5.09
−5.09
−4.91
−4.27
−4.09
−4.11
−3.93
−3.63
−3.65
−3.35
−3.12
−2.80
−2.85
−2.53
−2.25
−5.24
−5.07
−5.05
−4.87
−4.18
−4.01
−3.97
−3.80
−3.52
−3.52
−3.23
−2.90
−2.61
−2.62
−2.33
−2.16
−5.36
−5.27
−4.81
−4.70
−4.34
−4.24
−3.73
−3.61
−3.41
−3.33
−3.13
−2.09
−1.98
−1.81
−1.69
−2.48
−5.36
−5.22
−5.31
−5.17
−4.22
−4.09
−4.15
−4.01
−3.79
−3.73
−3.51
−3.23
−3.05
−3.01
−2.83
−2.36
−6.00
−6.00
−6.00
−6.00
−5.79
−5.59
−5.68
−5.47
−5.17
−5.19
−4.89
−4.68
−4.39
−4.39
−4.11
−3.68
−7. Diff country,
sex, and age
−6. Diff country
and sex
−5. Diff sex
and age
−4. Diff sex
−3. Diff country
and age
−2. Diff country
−1. Diff age
+0. Zero effort
+1. Same age
+2. Same sex
+3. Same sex
and age
+4. Same country
+5. Same country
and age
+6. Same country
and sex
+7. Same country,
sex, and age
+8. Same country,
female, old
1_Poland
1_Ukraine
1_Russia
6_Iran
6_Iraq
4_Jamaica
6_Pakistan
6_India
2_Nicaragua
2_Mexico
3_Nigeria
4_Haiti
3_Liberia
3_Ghana
2_El_Salvador
5_Kenya
5_Ethiopia
7_Japan
7_Thailand
7_Korea
7_Phillippines
7_China
7_Vietnam
5_Somalia
Country of origin of enrollee
How impostor is paired with enrollee
−6
−5
−4
−3
−2
−1
0
Algorithm: imperial_002
Threshold: 1.381120
Dataset: Application
Nominal FMR: 0.000030
log10 FMR
reports/11/figures/dhs_obim/cross_country/impostors/heatmap_fmr_country_x_same_same/imperial_002.pdf
Figure 4: The heatmap shows FMR for each country-of-birth, when the imposter comparisons are drawn from increasingly demographically-matched individuals.
Each cell depicts FMR on a logarithmic scale. The text value is log
10
(FMR) with large negative values encoding superior false match rates. The center row (“0.
Zero effort”) row compares individuals without regard to demographics. Rows above that pair imposters more closely until, in the second row, the imposters
are of the same sex, age and country of origin. The top row corresponds to one particular demographic often associated with the highest FMR values. The rows
below center pair for increasingly unlikely imposter pairings. For example “-5. Diff sex and age” shows FMR for imposters of different sex and age group. The
countries appear in order of increasing mean FMR. Values below -6 are pinned to -6. Annex 8 contains the corresponding figure for all algorithms.
Links:
EXEC. SUMMARY
TECH. SUMMARY
False positive: Incorrect association of two subjects 1:1 FMR 1:N FPIR
False negative: Failed association of one subject 1:1 FNMR 1:N FNIR
T 0 → FMR, FPIR → 0
→ FNMR, FNIR → 1

This publication is available free of charge from: https://doi.org/10.6028/NIST.IR.8280
2019/12/19 08:14:00 FRVT - FACE RECOGNITION VENDOR TEST - DEMOGRAPHICS 34
4.3 False match rates within and across countries
Method: Using high quality application portraits drawn from the corpus described in Annex 2 , we compared
442 019 images from 24 countries with 441 517 images of different individuals from the same countries, yielding
195.2 billion imposter comparisons. We executed this set of comparisons with 126 verification algorithms
submitted to the FRVT Verification track. These are listed in Table 4-6. We compared scores with a set of 10
thresholds to produce FMR estimates at each of those thresholds. The thresholds were computed over a set of
93 070 400 imposter comparisons made using a different set of images, namely the law enforcement mugshots
detailed in Annex 1 . Each threshold was selected as the lowest value that gave FMR at or below a target FMR.
The target FMR value was 0.00003.
Each photograph was assigned to the age groups defined by the intervals (00−20], (20−35], (35−50], (50−65],
and (65 − 99].
We excluded small numbers of photographs for which country of birth was not available, or for which sex was
not listed as male or female.
Each comparison is accompanied by sex, country of birth and age group metadata for the two individuals rep-
resented in the photographs. Given many comparisons with the same demographic pairing, we can produce
a measurement of FMR when comparing individuals from two demographic groups, for example Polish men
over the age of 65 with Mexican women between 20 and 35.
Analysis: To address the issue addressed in the title of this section we produced figures depicting cross-country
false match rates. Figure 5 is an example. We restricted the demographics to just men in the largest age group,
(35−50], and then repeated that for women. We remove sex and age from the discussion for two reasons: First,
to isolate the country-of-origin effect, and, second, to reflect what real-world imposters would do: procure
identity credentials from persons of the same age and sex.
Figure 5 shows cross-country FMR for one of the more accurate algorithms. Annex 7 contains corresponding
figures for all algorithms, for both men and women. The annex therefore extends to more than 250 pages.
We could repeat this visualization for other age groups - the results are similar. We discuss the effect of age
itself later. Likewise, we could repeat the visualization for other recognition thresholds. The one adopted
corresponds to a FMR = 0.00003. The trends are very similar at any threshold.
The Figure shows FMR as a heatmap. It uses a logarithmic scale, so that a FMR of 0.0001 is represented by a
color and a text value of -4, i.e. log to the base 10. Low FMR values are shown in blue. High FMR values are
shown in red. A grey color connotes the target FMR value (log
10
0.00003 = −4.5). High FMR values present a
security concern in verification applications.
Discussion: From the Figure and those in the annexes, we make a number of observations. First by assigning
Links:
EXEC. SUMMARY
TECH. SUMMARY
False positive: Incorrect association of two subjects 1:1 FMR 1:N FPIR
False negative: Failed association of one subject 1:1 FNMR 1:N FNIR
T 0 → FMR, FPIR → 0
→ FNMR, FNIR → 1

This publication is available free of charge from: https://doi.org/10.6028/NIST.IR.8280
2019/12/19 08:14:00 FRVT - FACE RECOGNITION VENDOR TEST - DEMOGRAPHICS 35
−4.47
−4.64
−4.55
−5.69
−5.89
−5.84
−6.00
−6.00
−6.00
−6.00
−6.00
−6.00
−6.00
−6.00
−6.00
−5.68
−5.37
−6.00
−6.00
−6.00
−6.00
−6.00
−6.00
−6.00
−4.71
−4.67
−4.68
−5.44
−5.36
−5.18
−6.00
−6.00
−6.00
−6.00
−6.00
−5.95
−6.00
−5.65
−5.68
−5.18
−5.16
−5.74
−5.37
−5.20
−5.16
−5.64
−5.65
−5.52
−4.52
−4.68
−4.44
−5.44
−5.50
−5.86
−6.00
−6.00
−6.00
−6.00
−6.00
−6.00
−6.00
−6.00
−5.94
−5.22
−5.14
−5.66
−5.96
−6.00
−6.00
−6.00
−5.87
−6.00
−5.64
−5.47
−5.60
−3.40
−3.41
−3.61
−6.00
−5.82
−6.00
−5.69
−5.64
−5.08
−5.75
−5.44
−4.98
−5.12
−4.89
−4.91
−4.87
−5.01
−5.28
−4.34
−4.51
−4.49
−5.84
−5.44
−5.46
−3.45
−3.15
−3.65
−6.00
−6.00
−6.00
−5.99
−5.75
−5.03
−5.91
−5.36
−5.15
−5.05
−4.73
−4.95
−4.94
−5.03
−5.30
−4.46
−4.60
−4.64
−6.00
−5.20
−5.78
−3.61
−3.64
−3.64
−5.89
−5.66
−5.60
−5.65
−5.26
−5.02
−6.00
−5.39
−4.87
−5.17
−4.94
−4.81
−5.12
−5.48
−5.77
−4.39
−4.55
−4.64
−6.00
−6.00
−6.00
−6.00
−6.00
−6.00
−3.21
−3.45
−3.37
−3.67
−3.94
−4.97
−3.88
−4.49
−6.00
−6.00
−6.00
−6.00
−6.00
−6.00
−6.00
−5.90
−5.55
−5.99
−6.00
−6.00
−6.00
−6.00
−6.00
−6.00
−3.43
−3.36
−3.47
−3.70
−4.05
−4.74
−3.91
−4.23
−6.00
−6.00
−6.00
−6.00
−6.00
−5.56
−6.00
−6.00
−6.00
−5.64
−6.00
−6.00
−6.00
−6.00
−6.00
−5.63
−3.38
−3.49
−3.33
−3.73
−3.94
−4.85
−3.88
−4.34
−5.86
−6.00
−6.00
−6.00
−6.00
−6.00
−6.00
−5.70
−5.78
−5.74
−6.00
−6.00
−6.00
−6.00
−6.00
−5.74
−3.67
−3.72
−3.69
−3.64
−3.91
−4.51
−4.01
−4.19
−5.84
−6.00
−6.00
−6.00
−6.00
−5.91
−6.00
−5.56
−5.56
−5.56
−6.00
−6.00
−6.00
−5.66
−5.67
−5.40
−3.94
−3.96
−3.94
−3.91
−3.93
−4.59
−4.12
−4.36
−5.25
−6.00
−6.00
−5.95
−5.99
−5.71
−6.00
−5.45
−5.32
−5.30
−6.00
−6.00
−6.00
−5.05
−5.12
−4.90
−4.91
−4.84
−4.83
−4.66
−4.59
−2.88
−4.01
−2.96
−4.59
−5.84
−5.30
−5.23
−6.00
−5.93
−6.00
−5.53
−5.42
−5.65
−6.00
−6.00
−6.00
−6.00
−6.00
−5.66
−3.90
−3.82
−3.86
−3.96
−4.19
−4.00
−3.40
−3.57
−5.18
−5.98
−6.00
−5.33
−6.00
−6.00
−6.00
−5.67
−5.55
−5.49
−6.00
−5.77
−6.00
−5.37
−5.51
−5.70
−4.60
−4.41
−4.49
−4.28
−4.34
−2.91
−3.48
−2.17
−4.96
−6.00
−5.43
−5.55
−6.00
−6.00
−6.00
−5.43
−5.42
−5.67
−6.00
−5.73
−6.00
−4.98
−5.06
−4.77
−6.00
−6.00
−5.98
−6.00
−5.51
−4.67
−4.90
−4.96
−3.58
−4.64
−4.79
−3.90
−5.46
−5.41
−5.60
−4.99
−5.33
−5.40
−5.48
−4.99
−5.32
−5.08
−4.95
−5.18
−6.00
−5.50
−6.00
−6.00
−6.00
−5.79
−5.85
−6.00
−4.63
−3.86
−4.11
−4.32
−6.00
−6.00
−6.00
−6.00
−6.00
−6.00
−5.58
−4.91
−5.22
−4.97
−4.76
−4.99
−6.00
−5.74
−6.00
−6.00
−5.99
−5.43
−6.00
−5.62
−4.76
−4.08
−3.77
−4.38
−6.00
−6.00
−6.00
−6.00
−6.00
−6.00
−5.74
−5.42
−5.63
−4.88
−4.94
−4.89
−6.00
−6.00
−6.00
−6.00
−5.69
−5.21
−5.25
−5.46
−3.90
−4.25
−4.38
−3.79
−6.00
−6.00
−6.00
−5.76
−5.81
−6.00
−6.00
−4.96
−6.00
−4.94
−4.92
−5.02
−6.00
−6.00
−6.00
−5.81
−5.94
−6.00
−6.00
−6.00
−5.42
−6.00
−6.00
−5.85
−2.99
−3.44
−3.27
−3.61
−3.35
−3.22
−6.00
−5.07
−6.00
−5.01
−4.98
−5.40
−5.74
−6.00
−6.00
−6.00
−5.92
−6.00
−6.00
−6.00
−5.68
−5.77
−6.00
−6.00
−3.39
−3.05
−3.24
−3.95
−3.66
−3.70
−6.00
−5.19
−6.00
−5.34
−5.39
−5.62
−5.81
−6.00
−6.00
−6.00
−6.00
−6.00
−6.00
−6.00
−5.72
−5.79
−6.00
−6.00
−3.22
−3.27
−2.97
−3.99
−3.66
−3.67
−6.00
−5.61
−6.00
−4.27
−4.35
−4.37
−5.83
−5.97
−5.87
−5.44
−5.22
−5.52
−5.87
−5.86
−5.23
−6.00
−6.00
−5.50
−3.62
−3.94
−4.00
−2.89
−3.24
−3.23
−6.00
−5.21
−6.00
−4.52
−4.64
−4.66
−5.68
−5.67
−5.51
−5.51
−5.32
−5.45
−6.00
−5.50
−5.33
−6.00
−6.00
−5.50
−3.35
−3.67
−3.63
−3.24
−3.14
−3.13
−6.00
−5.20
−6.00
−4.50
−4.59
−4.56
−5.86
−5.67
−5.71
−5.37
−5.24
−5.63
−6.00
−5.56
−5.50
−6.00
−6.00
−5.80
−3.20
−3.73
−3.68
−3.21
−3.13
−2.83
1_Poland
1_Russia
1_Ukraine
2_El_Salvador
2_Mexico
2_Nicaragua
3_Ghana
3_Liberia
3_Nigeria
4_Haiti
4_Jamaica
5_Ethiopia
5_Kenya
5_Somalia
6_India
6_Iran
6_Iraq
6_Pakistan
7_China
7_Japan
7_Korea
7_Phillippines
7_Thailand
7_Vietnam
1_Poland
1_Russia
1_Ukraine
2_El_Salvador
2_Mexico
2_Nicaragua
3_Ghana
3_Liberia
3_Nigeria
4_Haiti
4_Jamaica
5_Ethiopia
5_Kenya
5_Somalia
6_India
6_Iran
6_Iraq
6_Pakistan
7_China
7_Japan
7_Korea
7_Phillippines
7_Thailand
7_Vietnam
Demographics of enrollee
Demographics of impostor
−6 −5 −4 −3 −2 −1 0
Algorithm: imperial_002 Threshold: 1.381120 Dataset: Application
Nominal FMR: 0.000030 Sex: M log10 FMR
reports/11/figures/dhs_obim/cross_country/impostors/heatmap_fmr_country_x_country_only_male_35_50/imperial_002.pdf
Figure 5: For 24 countries in seven regions the figure shows false positive rates when the reference algorithm is used to
compare single photos of mid-aged male subjects from the countries identified in the respective columns. The threshold is
to a preset fixed value everywhere. Each cell depicts FMR on a logarithmic scale. The text value is log
10
(FMR) with large
negative values encoding superior false match rates. Annex 7 contains the corresponding figure for all algorithms.
Links:
EXEC. SUMMARY
TECH. SUMMARY
False positive: Incorrect association of two subjects 1:1 FMR 1:N FPIR
False negative: Failed association of one subject 1:1 FNMR 1:N FNIR
T 0 → FMR, FPIR → 0
→ FNMR, FNIR → 1

This publication is available free of charge from: https://doi.org/10.6028/NIST.IR.8280
2019/12/19 08:14:00 FRVT - FACE RECOGNITION VENDOR TEST - DEMOGRAPHICS 36
−4.12
−4.35
−4.24
−5.14
−5.13
−5.30
−6.00
−6.00
−6.00
−6.00
−5.99
−5.86
−6.00
−6.00
−5.84
−5.06
−4.92
−5.41
−5.78
−6.00
−5.82
−5.58
−5.31
−5.28
−4.27
−4.14
−4.20
−4.84
−4.94
−5.07
−6.00
−5.84
−6.00
−6.00
−5.96
−5.17
−5.91
−5.31
−5.48
−4.75
−4.62
−5.33
−4.52
−4.60
−4.58
−4.94
−4.88
−4.60
−4.24
−4.16
−4.05
−4.92
−4.91
−4.94
−5.84
−6.00
−6.00
−6.00
−5.99
−5.92
−5.85
−5.72
−5.46
−4.87
−4.71
−5.14
−5.67
−5.86
−5.97
−6.00
−5.76
−5.61
−5.18
−4.86
−4.83
−2.94
−3.08
−3.10
−5.13
−5.15
−5.09
−4.86
−4.79
−4.43
−5.20
−4.50
−4.09
−4.32
−4.02
−3.92
−4.42
−4.63
−4.83
−3.75
−3.94
−3.78
−5.20
−4.92
−4.99
−3.03
−2.96
−3.16
−5.17
−5.28
−5.22
−5.12
−4.95
−4.45
−5.19
−4.56
−4.28
−4.26
−3.99
−4.07
−4.51
−4.62
−4.84
−3.89
−4.12
−4.01
−5.20
−4.90
−4.95
−3.14
−3.25
−3.20
−5.02
−4.93
−5.03
−4.75
−4.68
−4.33
−5.01
−4.31
−4.16
−4.39
−4.15
−4.03
−4.73
−4.96
−5.07
−3.91
−4.16
−4.05
−6.00
−6.00
−5.89
−5.53
−5.57
−5.00
−2.70
−2.97
−2.87
−3.05
−3.29
−4.41
−3.40
−3.52
−5.47
−6.00
−5.89
−6.00
−5.06
−5.45
−5.79
−4.79
−4.94
−4.86
−6.00
−5.88
−6.00
−5.06
−5.45
−5.19
−2.92
−2.92
−3.03
−3.14
−3.32
−4.25
−3.40
−3.48
−5.34
−5.50
−5.14
−5.57
−5.11
−5.54
−5.55
−4.80
−5.01
−4.77
−6.00
−6.00
−5.85
−5.15
−5.38
−5.01
−2.89
−3.07
−2.92
−3.17
−3.38
−4.48
−3.47
−3.68
−5.59
−6.00
−5.85
−5.65
−5.08
−5.66
−5.55
−4.81
−4.83
−4.84
−6.00
−5.99
−5.85
−4.81
−5.22
−4.68
−3.03
−3.16
−3.13
−3.02
−3.31
−4.08
−3.39
−3.44
−5.13
−6.00
−5.93
−5.27
−4.89
−5.48
−5.56
−4.50
−4.55
−4.54
−6.00
−5.82
−5.86
−4.82
−5.02
−4.64
−3.28
−3.34
−3.36
−3.29
−3.37
−4.14
−3.61
−3.74
−4.98
−5.82
−5.48
−5.22
−5.22
−5.35
−5.74
−4.65
−4.86
−4.78
−6.00
−5.76
−5.65
−4.49
−4.46
−4.33
−4.38
−4.42
−4.46
−4.09
−4.13
−2.38
−3.36
−2.45
−4.17
−5.05
−4.56
−4.31
−5.39
−5.61
−6.00
−4.67
−4.84
−4.94
−6.00
−5.46
−6.00
−5.27
−5.39
−5.12
−3.47
−3.44
−3.51
−3.43
−3.61
−3.42
−2.90
−2.97
−4.75
−5.56
−5.18
−4.67
−5.27
−5.78
−5.86
−5.08
−4.82
−4.89
−6.00
−5.85
−6.00
−4.50
−4.53
−4.56
−3.79
−3.71
−3.84
−3.50
−3.82
−2.42
−2.78
−1.31
−3.99
−6.00
−4.36
−4.13
−4.85
−5.43
−5.30
−4.43
−4.35
−4.54
−5.81
−5.57
−5.41
−4.13
−4.32
−4.13
−5.67
−5.22
−5.41
−5.06
−4.92
−4.23
−4.60
−4.22
−3.12
−4.37
−4.12
−3.27
−4.76
−5.06
−5.12
−4.57
−4.83
−4.73
−5.14
−4.78
−4.78
−4.31
−4.22
−4.40
−6.00
−5.18
−6.00
−6.00
−5.85
−5.10
−5.55
−5.62
−4.38
−3.31
−3.42
−3.95
−5.46
−5.19
−5.36
−5.31
−5.45
−5.28
−4.87
−4.63
−4.64
−4.04
−4.03
−4.16
−6.00
−5.37
−5.87
−5.67
−5.53
−4.60
−5.09
−4.39
−4.11
−3.46
−3.06
−3.59
−6.00
−5.95
−6.00
−5.36
−5.63
−5.51
−5.58
−5.09
−5.06
−3.94
−4.11
−4.01
−5.62
−5.19
−5.47
−5.27
−5.01
−4.42
−4.80
−4.09
−3.32
−4.00
−3.62
−3.08
−5.48
−5.59
−5.75
−4.75
−4.97
−4.94
−5.65
−4.84
−5.52
−4.42
−4.56
−4.60
−5.13
−4.74
−5.10
−4.91
−5.10
−5.40
−5.09
−5.07
−5.14
−5.72
−5.99
−5.48
−2.56
−3.00
−2.82
−3.22
−3.02
−2.75
−5.78
−4.82
−5.73
−4.65
−4.61
−4.81
−5.56
−5.31
−5.65
−5.53
−5.46
−5.69
−5.67
−5.25
−5.44
−5.79
−5.98
−5.39
−3.01
−2.68
−2.83
−3.73
−3.42
−3.33
−5.84
−4.70
−5.89
−4.85
−4.84
−5.03
−5.85
−5.58
−5.89
−5.58
−5.53
−5.76
−5.63
−5.54
−5.39
−5.86
−6.00
−5.51
−2.82
−2.83
−2.55
−3.79
−3.31
−3.16
−5.81
−5.38
−5.63
−3.76
−3.97
−3.81
−4.74
−4.59
−4.81
−4.51
−4.58
−4.65
−4.89
−4.38
−4.61
−5.39
−5.52
−4.80
−3.24
−3.74
−3.78
−2.56
−2.89
−2.81
−5.66
−5.18
−5.73
−3.93
−4.13
−4.08
−4.86
−4.87
−4.99
−4.62
−4.73
−4.92
−4.98
−4.57
−4.80
−5.49
−5.56
−4.94
−3.02
−3.40
−3.33
−2.87
−2.71
−2.66
−5.40
−5.17
−5.46
−3.77
−4.09
−3.90
−4.78
−4.63
−4.77
−4.52
−4.61
−4.88
−4.84
−4.58
−4.90
−5.21
−5.37
−4.90
−2.74
−3.28
−3.16
−2.75
−2.61
−2.27
1_Poland
1_Russia
1_Ukraine
2_El_Salvador
2_Mexico
2_Nicaragua
3_Ghana
3_Liberia
3_Nigeria
4_Haiti
4_Jamaica
5_Ethiopia
5_Kenya
5_Somalia
6_India
6_Iran
6_Iraq
6_Pakistan
7_China
7_Japan
7_Korea
7_Phillippines
7_Thailand
7_Vietnam
1_Poland
1_Russia
1_Ukraine
2_El_Salvador
2_Mexico
2_Nicaragua
3_Ghana
3_Liberia
3_Nigeria
4_Haiti
4_Jamaica
5_Ethiopia
5_Kenya
5_Somalia
6_India
6_Iran
6_Iraq
6_Pakistan
7_China
7_Japan
7_Korea
7_Phillippines
7_Thailand
7_Vietnam
Demographics of enrollee
Demographics of impostor
−6 −5 −4 −3 −2 −1 0
Algorithm: imperial_002 Threshold: 1.381120 Dataset: Application
Nominal FMR: 0.000030 Sex: F log10 FMR
reports/11/figures/dhs_obim/cross_country/impostors/heatmap_fmr_country_x_country_only_female_35_50/imperial_002.pdf
Figure 6: For 24 countries in seven regions the figure shows false positive rates when the reference algorithm is used to
compare single photos of mid-aged female subjects from the countries identified in the respective columns. The threshold
is to a preset fixed value everywhere. Each cell depicts FMR on a logarithmic scale. The text value is log
10
(FMR) with large
negative values encoding superior false match rates. Annex 7 contains the corresponding figure for all algorithms.
Links:
EXEC. SUMMARY
TECH. SUMMARY
False positive: Incorrect association of two subjects 1:1 FMR 1:N FPIR
False negative: Failed association of one subject 1:1 FNMR 1:N FNIR
T 0 → FMR, FPIR → 0
→ FNMR, FNIR → 1

This publication is available free of charge from: https://doi.org/10.6028/NIST.IR.8280
2019/12/19 08:14:00 FRVT - FACE RECOGNITION VENDOR TEST - DEMOGRAPHICS 37
−4.49
−4.76
−4.57
−5.75
−5.74
−5.84
−6.00
−6.00
−6.00
−6.00
−6.00
−6.00
−6.00
−6.00
−6.00
−5.75
−5.52
−5.92
−6.00
−6.00
−6.00
−6.00
−6.00
−6.00
−4.83
−4.73
−4.74
−5.48
−5.70
−5.41
−6.00
−6.00
−6.00
−6.00
−6.00
−6.00
−6.00
−6.00
−5.98
−5.56
−5.42
−6.00
−6.00
−6.00
−6.00
−6.00
−6.00
−6.00
−4.57
−4.65
−4.50
−5.44
−5.64
−5.63
−6.00
−6.00
−6.00
−6.00
−6.00
−6.00
−6.00
−6.00
−6.00
−5.36
−5.37
−6.00
−6.00
−6.00
−6.00
−6.00
−6.00
−6.00
−5.72
−5.57
−5.55
−3.65
−3.73
−3.83
−6.00
−6.00
−6.00
−5.92
−5.74
−5.23
−6.00
−5.62
−5.49
−5.62
−5.28
−5.47
−6.00
−5.75
−6.00
−4.88
−5.09
−5.17
−5.70
−5.51
−5.59
−3.74
−3.43
−3.87
−6.00
−6.00
−6.00
−5.96
−5.98
−5.25
−6.00
−5.72
−5.91
−5.44
−5.20
−5.58
−6.00
−6.00
−6.00
−4.98
−5.32
−5.54
−6.00
−5.45
−5.67
−3.86
−3.99
−3.87
−6.00
−6.00
−6.00
−5.70
−5.43
−5.42
−6.00
−5.70
−5.38
−5.74
−5.35
−5.27
−6.00
−6.00
−6.00
−4.96
−5.49
−5.29
−6.00
−6.00
−6.00
−6.00
−6.00
−6.00
−3.73
−4.06
−3.93
−4.23
−4.49
−5.23
−4.49
−5.04
−6.00
−6.00
−6.00
−6.00
−6.00
−6.00
−6.00
−6.00
−6.00
−6.00
−6.00
−6.00
−6.00
−6.00
−6.00
−6.00
−4.05
−4.03
−4.12
−4.33
−4.49
−5.23
−4.49
−5.03
−6.00
−6.00
−6.00
−6.00
−6.00
−6.00
−6.00
−6.00
−6.00
−6.00
−6.00
−6.00
−6.00
−6.00
−6.00
−6.00
−3.99
−4.10
−3.96
−4.36
−4.50
−5.16
−4.52
−5.20
−6.00
−6.00
−6.00
−6.00
−6.00
−6.00
−6.00
−6.00
−6.00
−6.00
−6.00
−6.00
−6.00
−6.00
−6.00
−5.63
−4.21
−4.34
−4.31
−4.10
−4.33
−4.89
−4.49
−4.73
−6.00
−6.00
−6.00
−6.00
−6.00
−6.00
−6.00
−6.00
−6.00
−6.00
−6.00
−6.00
−6.00
−5.79
−5.77
−5.82
−4.46
−4.51
−4.47
−4.30
−4.25
−4.94
−4.57
−4.74
−5.78
−6.00
−6.00
−6.00
−6.00
−6.00
−6.00
−6.00
−5.98
−5.94
−6.00
−6.00
−6.00
−5.29
−5.42
−5.21
−5.32
−5.37
−5.29
−4.96
−4.88
−3.20
−4.36
−3.38
−5.43
−6.00
−5.73
−5.63
−6.00
−6.00
−6.00
−6.00
−6.00
−6.00
−6.00
−6.00
−6.00
−6.00
−5.94
−5.66
−4.51
−4.51
−4.52
−4.51
−4.58
−4.31
−3.85
−4.21
−5.79
−6.00
−6.00
−5.72
−6.00
−6.00
−6.00
−6.00
−6.00
−6.00
−6.00
−6.00
−6.00
−5.70
−5.48
−5.80
−5.17
−5.20
−5.11
−4.82
−4.72
−3.43
−4.01
−2.60
−5.54
−6.00
−6.00
−6.00
−6.00
−6.00
−6.00
−6.00
−6.00
−6.00
−6.00
−6.00
−6.00
−5.62
−5.58
−5.26
−6.00
−6.00
−6.00
−6.00
−6.00
−5.37
−5.43
−5.80
−4.35
−5.34
−5.62
−4.70
−6.00
−6.00
−6.00
−5.66
−5.85
−6.00
−5.72
−5.43
−5.56
−5.55
−5.56
−5.85
−6.00
−6.00
−6.00
−6.00
−6.00
−6.00
−5.94
−6.00
−5.37
−4.43
−4.69
−5.02
−6.00
−6.00
−6.00
−6.00
−6.00
−6.00
−5.36
−5.19
−5.26
−5.30
−5.19
−5.42
−6.00
−6.00
−6.00
−6.00
−6.00
−5.73
−6.00
−6.00
−5.57
−4.68
−4.36
−5.01
−6.00
−6.00
−6.00
−6.00
−6.00
−6.00
−6.00
−5.57
−6.00
−5.43
−5.51
−5.62
−6.00
−6.00
−6.00
−6.00
−6.00
−5.82
−5.57
−6.00
−4.66
−4.93
−5.02
−4.47
−6.00
−6.00
−6.00
−6.00
−6.00
−6.00
−6.00
−6.00
−6.00
−6.00
−6.00
−6.00
−6.00
−6.00
−6.00
−6.00
−6.00
−6.00
−6.00
−6.00
−6.00
−6.00
−6.00
−6.00
−4.53
−4.74
−4.66
−5.02
−4.80
−4.69
−6.00
−6.00
−6.00
−5.97
−5.91
−6.00
−5.98
−6.00
−6.00
−6.00
−6.00
−6.00
−6.00
−6.00
−6.00
−6.00
−6.00
−6.00
−4.71
−3.86
−4.26
−5.01
−4.76
−4.93
−6.00
−6.00
−6.00
−6.00
−6.00
−6.00
−6.00
−6.00
−6.00
−6.00
−6.00
−6.00
−6.00
−6.00
−6.00
−6.00
−6.00
−6.00
−4.66
−4.27
−4.00
−5.33
−4.97
−5.16
−6.00
−6.00
−6.00
−4.88
−4.94
−4.82
−6.00
−6.00
−6.00
−6.00
−5.68
−5.84
−6.00
−6.00
−5.84
−6.00
−6.00
−6.00
−4.93
−4.85
−5.32
−3.53
−4.14
−4.21
−6.00
−6.00
−6.00
−5.31
−5.59
−5.26
−6.00
−6.00
−6.00
−6.00
−5.86
−6.00
−6.00
−6.00
−6.00
−6.00
−5.84
−5.89
−4.82
−4.85
−4.94
−4.09
−4.09
−4.24
−6.00
−6.00
−6.00
−5.16
−5.52
−5.21
−6.00
−6.00
−6.00
−5.89
−6.00
−6.00
−6.00
−5.80
−6.00
−6.00
−6.00
−6.00
−4.72
−4.93
−5.11
−4.19
−4.23
−3.96
1_Poland
1_Russia
1_Ukraine
2_El_Salvador
2_Mexico
2_Nicaragua
3_Ghana
3_Liberia
3_Nigeria
4_Haiti
4_Jamaica
5_Ethiopia
5_Kenya
5_Somalia
6_India
6_Iran
6_Iraq
6_Pakistan
7_China
7_Japan
7_Korea
7_Phillippines
7_Thailand
7_Vietnam
1_Poland
1_Russia
1_Ukraine
2_El_Salvador
2_Mexico
2_Nicaragua
3_Ghana
3_Liberia
3_Nigeria
4_Haiti
4_Jamaica
5_Ethiopia
5_Kenya
5_Somalia
6_India
6_Iran
6_Iraq
6_Pakistan
7_China
7_Japan
7_Korea
7_Phillippines
7_Thailand
7_Vietnam
Demographics of enrollee
Demographics of impostor
−6 −5 −4 −3 −2 −1 0
Algorithm: yitu_003 Threshold: 37.785000 Dataset: Application
Nominal FMR: 0.000030 Sex: M log10 FMR
reports/11/figures/dhs_obim/cross_country/impostors/heatmap_fmr_country_x_country_only_male_35_50/yitu_003.pdf
Figure 7: For 24 countries in seven regions the figure shows false positive rates when the Chinese-developed algorithm
is used to compare single photos of mid-aged male subjects from the countries identified in the respective columns. The
threshold is to a preset fixed value everywhere. Each cell depicts FMR on a logarithmic scale. The text value is log
10
(FMR)
with large negative values encoding superior false match rates. Annex 7 contains the corresponding figure for all algo-
rithms.
Links:
EXEC. SUMMARY
TECH. SUMMARY
False positive: Incorrect association of two subjects 1:1 FMR 1:N FPIR
False negative: Failed association of one subject 1:1 FNMR 1:N FNIR
T 0 → FMR, FPIR → 0
→ FNMR, FNIR → 1

This publication is available free of charge from: https://doi.org/10.6028/NIST.IR.8280
2019/12/19 08:14:00 FRVT - FACE RECOGNITION VENDOR TEST - DEMOGRAPHICS 38
countries into the following regions
1: Eastern Europe - Russia, Poland and Ukraine
2: Central America - Mexico, Honduras, El Salvador, Nicaragua
3: West Africa - Ghana, Liberia, Nigeria
4: The Caribbean - Haiti, Jamaica
5: East Africa - Ethiopia, Kenya, Somalia
6: South Asia - India, Iran, Iraq, Pakistan
7: East Asia - China, Japan, Korea, Philippines, Thailand, Vietnam
we see a block structure, in particular a block-diagonal structure indicative of strongly correlated false match
rates within region. For example it is true that when comparing photos of individuals from East Africa with
those from Eastern Europe, most algorithms give very low FMR. The more interesting results are within-region,
around the diagonal, and between regions along the diagonal. We now note the following common trends, and
then some notable exceptions. We then conclude with some comments on what the ideal situation would be,
and on the meaning. Each Annex includes a “contact sheet” which shows all heatmaps on a single page as
thumbnails. The idea is to show macroscopic behavior across all algorithms. When viewed on a computer the
figure has very high resolution and zooming in reveals full detail; when printed it will likely just show coarse
trends.
Nominal FMR in Eastern Europe: For many algorithms, FMR within Eastern Europe is close to the nom-
inal target false match rate i.e. a grey color, −5 ≤ log
10
FMR ≤ −4. There are few exceptions to this, even
for algorithms developed in China, Western Europe and the USA.
Higher FMR in East Africa: For almost all algorithms the highest FMR is for comparison of Somali faces.
We suspected this could be due to mislabeled data or statistical (in)significance but rejected those possi-
bilities
10
. Further the FMR is high within Ethiopia and between Ethiopia and Somalia. Similarly Kenya-
Kenya comparisons give high FMR, although somewhat reduced. In a substantial majority of photos of
Somalian women, the subject is wearing full head dress that typically covers the hair and ears leaving
only the face exposed. While this might produce false positives, headwear is almost always absent in
photographs of men. Further work is needed to explain the observation in more detail.
10
We discount that this result is anomalous as follows: 1. The sample size may be small for this study, but not absolutely small: The
Somalia-Somalia FMR measurement is obtained from 1 733 116 comparisons involving 2632 images of 1974 males. 2. The effect persists
when comparing Somalian and Ethiopian faces, and we’d suspect that ground-truth labelling errors - instances of one person being
present two IDs - would not persist across national boundaries. 3. In addition to high FMR, which is a count of high imposter scores, the
mean similarity score is also very high, an observation that again applies to all algorithms.
Links:
EXEC. SUMMARY
TECH. SUMMARY
False positive: Incorrect association of two subjects 1:1 FMR 1:N FPIR
False negative: Failed association of one subject 1:1 FNMR 1:N FNIR
T 0 → FMR, FPIR → 0
→ FNMR, FNIR → 1

This publication is available free of charge from: https://doi.org/10.6028/NIST.IR.8280
2019/12/19 08:14:00 FRVT - FACE RECOGNITION VENDOR TEST - DEMOGRAPHICS 39
Higher FMR in West Africa too: The countries with the second highest FMR tend to be in West Africa,
i.e. Ghana, Liberia and Nigeria. These countries do not share any borders. The high FMR values occur
almost equally within and between countries.
Higher FMR between West Africa and the Caribbean: Elevated FMR occurs when comparing faces of
individuals from countries in West Africa with those in the Caribbean.
Higher FMR between West and East Africa: Elevated FMR occurs when comparing faces of individuals
from countries in West Africa and Kenya. The effect is often lower than within either region alone.
However, the high FMR does not extend to comparisons of West African and Ethiopian or Somali faces.
Higher FMR in East Asia: It is very common for algorithms to give high FMR within East Asian countries
and between them. For the algorithm shown, Vietnamese faces strongly match other Vietnamese, and
with all the other countries in the region. The East Asian block often divides into northern and southern
blocks with reduced, but still high, FMR when individuals are compared between those blocks (e.g.
Korea and Vietnam).
Some Chinese algorithms give nominal FMR when comparing Chinese: As shown in Annex 7 some
algorithms developed in China exhibit much reduced FMR on the East Asian population - for example,
see Figure 7. These algorithms are from Megvii, Meiya, Hik Vision, Dahua, X-Laboratory, Yitu and SHU
(Shanghai University Film Academy). For Deepsea Tencent the same applies, but less prominently in
South East Asia. In some cases the effect is only apparent for comparisons involving images of Chinese,
e.g. Star Hybrid. Other Chinese algorithms, however, exhibit the more common trend of producing
elevated FMR across East Asia. These include developers of more accurate algorithm such as Alphaface,
Deepglint and Sensetime. Thus it is not sufficient for an algorithm to be developed in China for it to
mitigate the FMR increase on images from the local population.
One of the most accurate algorithms produces more uniform FMR: The corresponding Figure for the Yitu-
003 algorithm - Figure 7) - shows that the demographic differentials in FMR are attenuated. As noted the
FMR values for comparisons within East Asia are near the nominal value. Notably, however, this applies
to West Africa also. This appears to be an important result, as it is a proof that some algorithms do
not exhibit higher FMR in those populations. Yitu reported in a meeting in London in October 2017
that its training data included on order of 10
9
photographs of an unspecified (lower) number of Chinese
nationals. Whether that is the entirety of their training data is not known.
Developer dependency does not apply to South Asia: Neither Lookman nor Tiger IT’s algorithm produce
nominal FMR on the S. Asian imposter comparisons.
Links:
EXEC. SUMMARY
TECH. SUMMARY
False positive: Incorrect association of two subjects 1:1 FMR 1:N FPIR
False negative: Failed association of one subject 1:1 FNMR 1:N FNIR
T 0 → FMR, FPIR → 0
→ FNMR, FNIR → 1

This publication is available free of charge from: https://doi.org/10.6028/NIST.IR.8280
2019/12/19 08:14:00 FRVT - FACE RECOGNITION VENDOR TEST - DEMOGRAPHICS 40
Magnitudes are large: The East African FMR values are often two orders of magnitude higher than
the nominal value and those recorded within Eastern Europe. That is, the log
10
FMR values are +2
higher corresponding to FMR that is of order 100 times larger than the de-facto baseline. From a security
perspective this is analogous to using a two-digit PIN instead of the common four digits. For West
Africa, the FMR values are between one and two orders of magnitude above baseline. A shift of 1.4 on
the logarithmic scale corresponds to a factor of 25 increase, for example.
Anomalies in the figures: The cross-country heatmaps for the SIAT-004, Panasonic PSL-001, and Sensetime-
002 algorithms are mostly red, indicating high false match rates for all comparisons. This may arise be-
cause the threshold used was computed over comparisons of a different kind of images - mugshots not
application portraits. The algorithms are told what kind of image they are being given at the time fea-
tures are extracted from the image. The consequence is that the imposter distribution for mugshots looks
different to that for the application images, and thus thresholds are not portable. This would present
an operational issue to any end-user not informed to set the threshold accordingly. In any case, while
the heatmaps are mostly red, they still exhibit the same kind of FMR variations seen for many other
algorithms.
Discussion: The heatmap figures of Annex 7 show a widespread elevation of false match rates in African
faces relative to those in Eastern Europe. The reasons for these shifts are unknown. We did not make any
attempts to explain the effects. To summarize the effect we include the scatter plots of Figures 10 - 9. Each
point corresponds to one algorithm. Its coordinates show false match rates within West Africa against those
within Eastern Europe. The degree to which the point is above the diagonal line shows the extent that FMR in
the African countries exceeds that in the Eastern European ones.
We note several outcomes of this visualization.
Worst case In the scatter plot for African women Figure 9 there is a cluster of algorithms located near
x = 0.00012 and y = 0.003. Compared to the target FMR value of 0.00003 (the vertical line) there is a near
four-fold increase in FMR of women over men. Much more significantly there is a more than 100-fold
vertical excursion from white men to African women.
Dispersion Some algorithms, most notably those from Sensetime give FMR much different to the target
value. The threshold was set using Annex 1 mugshots but the Figure reflects FMR measured over
comparison of Annex 2 application photos. Both sets of photos are well illuminated portraits, so this
instability across datasets would be unwelcome, especially if an algorithm were to be fielded on imagery
qualitatively different. Many algorithms do give the expected FMR for white men FMR = 0.00003 as seen
in Figure 8.
Links:
EXEC. SUMMARY
TECH. SUMMARY
False positive: Incorrect association of two subjects 1:1 FMR 1:N FPIR
False negative: Failed association of one subject 1:1 FNMR 1:N FNIR
T 0 → FMR, FPIR → 0
→ FNMR, FNIR → 1

This publication is available free of charge from: https://doi.org/10.6028/NIST.IR.8280
2019/12/19 08:14:00 FRVT - FACE RECOGNITION VENDOR TEST - DEMOGRAPHICS 41
Figures 10 and 11 repeat the scatterplot summaries for the East Asian demographic too. The picture there is
more interesting. While the same pattern is present, it is clear that some algorithms developed in China do
not give elevated false match rates relative to Eastern Europeans. The absence of the effect is important in
that it implies high FMR in that population is not inevitable. We did not see a corresponding improvement
for South Asian faces for the few algorithms we understand were submitted by developers there (in India and
Bangladesh).
Links:
EXEC. SUMMARY
TECH. SUMMARY
False positive: Incorrect association of two subjects 1:1 FMR 1:N FPIR
False negative: Failed association of one subject 1:1 FNMR 1:N FNIR
T 0 → FMR, FPIR → 0
→ FNMR, FNIR → 1

This publication is available free of charge from: https://doi.org/10.6028/NIST.IR.8280
2019/12/19 08:14:00 FRVT - FACE RECOGNITION VENDOR TEST - DEMOGRAPHICS 42
●
●
●
●
●
●
●
●
●
●
●
●
●
●
●
●
●
●
●
●
●
●
●
●
●
●
●
●
●
●
●
●
●
●
●
●
●
●
●
●
●
●
●
●
●
●
●
●
●
●
●
●
●
●
●
●
●
●
●
●
●
●
●
●
●
●
●
●
●
●
●
●
●
●
●
●
●
●
●
●
●
●
●
●
●
●
●
●
●
●
●
●
●
●
●
●
●
●
●
●
●
●
●
●
●
●
●
●
●
●
●
●
●
●
●
●
●
●
●
●
●
●
●
●
●
●
●
●
●
●
●
●
●
●
ulsee_1
synesis_4
camvi_4
intellifusion_1
starhybrid_1
sensetime_1
psl_2
sensetime_2
siat_4
ceiec_2
synesis_5
visionbox_1
saffe_2
camvi_2
f8_1
anke_4
winsense_0
alphaface_1
pixelall_2
anke_3
vion_0
allgovision_0
visionbox_0
x−laboratory_0
siat_2
ceiec_1
nodeflux_2
meiya_1
shu_1
gorilla_3
kneron_3
smilart_3
upc_1
gorilla_2
cyberextruder_2
digitalbarriers_2
cognitec_1
cognitec_0
nodeflux_1
rankone_7
microfocus_2
shaman_1
glory_0
glory_1
toshiba_3
toshiba_2
rankone_6
rokid_0
saffe_1
microfocus_1
isystems_2
iit_1
isystems_1
alchera_0
kedacom_0
lookman_2
intellicloudai_1
alchera_1
iit_0
lookman_4
adera_1
visionlabs_7
visionlabs_6
bm_1
uluface_2
videonetics_1
hr_1
tevian_4
realnetworks_2
imagus_0
realnetworks_3
kakao_2
isap_1
dsk_0
imperial_2
facesoft_0
deepglint_1
deepsea_1
intsysmsu_0
imperial_0
mt_0
anyvision_4
cyberlink_2
incode_4
ntechlab_7
incode_3
anyvision_2
ntechlab_6
everai_2
everai_paravision_3
3divi_3
vigilantsolutions_7
via_0
vigilantsolutions_6
3divi_4
veridas_1
veridas_2
amplifiedgroup_1
aware_3
ctbcbank_0
aware_4
yisheng_4
innovatrics_6
innovatrics_4
intellivision_2
yitu_3
tongyi_5
neurotechnology_5
einetworks_0
hik_1
megvii_2
remarkai_0
remarkai_1
itmo_5
megvii_1
dermalog_5
dermalog_6
itmo_6
chtface_1
tech5_3
tech5_2
tiger_3
tiger_2
intelresearch_0
vocord_7
vocord_6
neurotechnology_6
cogent_3
cogent_4
idemia_4
dahua_3
dahua_2
id3_4
id3_3
T set for FMR = 0.000030 in
US mugshots of white men
8e−06
1e−05
2e−05
3e−05
5e−05
8e−05
1e−04
2e−04
3e−04
5e−04
8e−04
1e−03
2e−03
3e−03
5e−03
8e−03
1e−02
2e−02
3e−02
5e−02
1e−06 3e−06 5e−06 1e−05 3e−05 5e−05 1e−04 3e−04 5e−04 1e−03 3e−03 5e−03 1e−02
False match rate in men within E. Europe
False match rate in men within W. Africa
Dataset:
Application
Photos
●
●
●
●
●
●
●
●
●
●
●
●
●
●
●
●
●
●
●
●
AU
BG
CH
CN
DE
ES
FR
ID
IN
IS
JP
KR
LI
PT
RU
SG
SK
TW
UK
USA
Figure 8: The scatter plot shows FMR when comparing same-age men within and across three Eastern European countries
(Russia, Ukraine, Poland), against FMR obtained comparing men within and across three West African countries (Ghana,
Liberia, Nigeria). The threshold is fixed for each algorithm to give the FMR noted in the annotation over white men in
the U.S. mugshot database. This is indicated by the vertical and horizontal green lines. The blue diagonal line y = x is
included to show “over/under”. The color code identifies the domicile of the developer - some multinationals conduct
research elsewhere. Training data likewise may originate elsewhere.
Links:
EXEC. SUMMARY
TECH. SUMMARY
False positive: Incorrect association of two subjects 1:1 FMR 1:N FPIR
False negative: Failed association of one subject 1:1 FNMR 1:N FNIR
T 0 → FMR, FPIR → 0
→ FNMR, FNIR → 1

This publication is available free of charge from: https://doi.org/10.6028/NIST.IR.8280
2019/12/19 08:14:00 FRVT - FACE RECOGNITION VENDOR TEST - DEMOGRAPHICS 43
●
●
●
●
●
●
●
●
●
●
●
●
●
●
●
●
●
●
●
●
●
●
●
●
●
●
●
●
●
●
●
●
●
●
●
●
●
●
●
●
●
●
●
●
●
●
●
●
●
●
●
●
●
●
●
●
●
●
●
●
●
●
●
●
●
●
●
●
●
●
●
●
●
●
●
●
●
●
●
●
●
●
●
●
●
●
●
●
●
●
●
●
●
●
●
●
●
●
●
●
●
●
●
●
●
●
●
●
●
●
●
●
●
●
●
●
●
●
●
●
●
●
●
●
●
●
●
●
●
●
●
●
●
●
ulsee_1
synesis_4
camvi_4
intellifusion_1
starhybrid_1
sensetime_1
psl_2
sensetime_2
siat_4
ceiec_2
synesis_5
visionbox_1
saffe_2
camvi_2
f8_1
anke_4
winsense_0
alphaface_1
pixelall_2
anke_3
vion_0
allgovision_0
visionbox_0
x−laboratory_0
siat_2
ceiec_1
nodeflux_2
meiya_1
shu_1
gorilla_3
kneron_3
smilart_3
upc_1
gorilla_2
cyberextruder_2
digitalbarriers_2
cognitec_1
cognitec_0
nodeflux_1
rankone_7
microfocus_2
shaman_1
glory_0
glory_1
toshiba_3
toshiba_2
rankone_6
rokid_0
saffe_1
microfocus_1
isystems_2
iit_1
isystems_1
alchera_0
kedacom_0
lookman_2
intellicloudai_1
alchera_1
iit_0
lookman_4
adera_1
visionlabs_7
visionlabs_6
bm_1
uluface_2
videonetics_1
hr_1
tevian_4
realnetworks_2
imagus_0
realnetworks_3
kakao_2
isap_1
dsk_0
imperial_2
facesoft_0
deepglint_1
deepsea_1
intsysmsu_0
imperial_0
mt_0
anyvision_4
cyberlink_2
incode_4
ntechlab_7
incode_3
anyvision_2
ntechlab_6
everai_2
everai_paravision_3
3divi_3
vigilantsolutions_7
via_0
vigilantsolutions_6
3divi_4
veridas_1
veridas_2
amplifiedgroup_1
aware_3
ctbcbank_0
aware_4
yisheng_4
innovatrics_6
innovatrics_4
intellivision_2
yitu_3
tongyi_5
neurotechnology_5
einetworks_0
hik_1
megvii_2
remarkai_0
remarkai_1
itmo_5
megvii_1
dermalog_5
dermalog_6
itmo_6
chtface_1
tech5_3
tech5_2
tiger_3
tiger_2
intelresearch_0
vocord_7
vocord_6
neurotechnology_6
cogent_3
cogent_4
idemia_4
dahua_3
dahua_2
id3_4
id3_3
T set for FMR = 0.000030 in
US mugshots of white men
2e−05
3e−05
5e−05
8e−05
1e−04
2e−04
3e−04
5e−04
8e−04
1e−03
2e−03
3e−03
5e−03
8e−03
1e−02
2e−02
3e−02
5e−02
8e−02
1e−01
1e−06 3e−06 5e−06 1e−05 3e−05 5e−05 1e−04 3e−04 5e−04 1e−03 3e−03 5e−03 1e−02
False match rate in women within E. Europe
False match rate in women within W. Africa
Dataset:
Application
Photos
●
●
●
●
●
●
●
●
●
●
●
●
●
●
●
●
●
●
●
●
AU
BG
CH
CN
DE
ES
FR
ID
IN
IS
JP
KR
LI
PT
RU
SG
SK
TW
UK
USA
Figure 9: The scatter plot shows FMR when comparing same-age women within and across three Eastern European coun-
tries (Russia, Ukraine, Poland), against FMR obtained comparing women within and across three West African countries
(Ghana, Liberia, Nigeria). The threshold is fixed for each algorithm to give the FMR noted in the annotation over white
men in the U.S. mugshot database. This is indicated by the vertical and horizontal green lines. The blue diagonal line y = x
is included to show “over/under”. The color code identifies the domicile of the developer - some multinationals conduct
research elsewhere. Training data likewise may originate elsewhere.
Links:
EXEC. SUMMARY
TECH. SUMMARY
False positive: Incorrect association of two subjects 1:1 FMR 1:N FPIR
False negative: Failed association of one subject 1:1 FNMR 1:N FNIR
T 0 → FMR, FPIR → 0
→ FNMR, FNIR → 1

This publication is available free of charge from: https://doi.org/10.6028/NIST.IR.8280
2019/12/19 08:14:00 FRVT - FACE RECOGNITION VENDOR TEST - DEMOGRAPHICS 44
●
●
●
●
●
●
●
●
●
●
●
●
●
●
●
●
●
●
●
●
●
●
●
●
●
●
●
●
●
●
●
●
●
●
●
●
●
●
●
●
●
●
●
●
●
●
●
●
●
●
●
●
●
●
●
●
●
●
●
●
●
●
●
●
●
●
●
●
●
●
●
●
●
●
●
●
●
●
●
●
●
●
●
●
●
●
●
●
●
●
●
●
●
●
●
●
●
●
●
●
●
●
●
●
●
●
●
●
●
●
●
●
●
●
●
●
●
●
●
●
●
●
●
●
●
●
●
●
●
●
●
●
●
●
ulsee_1
synesis_4
camvi_4
intellifusion_1
starhybrid_1
sensetime_1
psl_2
sensetime_2
siat_4
ceiec_2
synesis_5
visionbox_1
saffe_2
camvi_2
f8_1
anke_4
winsense_0
alphaface_1
pixelall_2
anke_3
vion_0
allgovision_0
visionbox_0
x−laboratory_0
siat_2
ceiec_1
nodeflux_2
meiya_1
shu_1
gorilla_3
kneron_3
smilart_3
upc_1
gorilla_2
cyberextruder_2
digitalbarriers_2
cognitec_1
cognitec_0
nodeflux_1
rankone_7
microfocus_2
shaman_1
glory_0
glory_1
toshiba_3
toshiba_2
rankone_6
rokid_0
saffe_1
microfocus_1
isystems_2
iit_1
isystems_1
alchera_0
kedacom_0
lookman_2
intellicloudai_1
alchera_1
iit_0
lookman_4
adera_1
visionlabs_7
visionlabs_6
bm_1
uluface_2
videonetics_1
hr_1
tevian_4
realnetworks_2
imagus_0
realnetworks_3
kakao_2
isap_1
dsk_0
imperial_2
facesoft_0
deepglint_1
deepsea_1
intsysmsu_0
imperial_0
mt_0
anyvision_4
cyberlink_2
incode_4
ntechlab_7
incode_3
anyvision_2
ntechlab_6
everai_2
everai_paravision_3
3divi_3
vigilantsolutions_7
via_0
vigilantsolutions_6
3divi_4
veridas_1
veridas_2
amplifiedgroup_1
aware_3
ctbcbank_0
aware_4
yisheng_4
innovatrics_6
innovatrics_4
intellivision_2
yitu_3
tongyi_5
neurotechnology_5
einetworks_0
hik_1
megvii_2
remarkai_0
remarkai_1
itmo_5
megvii_1
dermalog_5
dermalog_6
itmo_6
chtface_1
tech5_3
tech5_2
tiger_3
tiger_2
intelresearch_0
vocord_7
vocord_6
neurotechnology_6
cogent_3
cogent_4
idemia_4
dahua_3
dahua_2
id3_4
id3_3
T set for FMR = 0.000030 in
US mugshots of white men
8e−07
1e−06
2e−06
3e−06
5e−06
8e−06
1e−05
2e−05
3e−05
5e−05
8e−05
1e−04
2e−04
3e−04
5e−04
8e−04
1e−03
2e−03
3e−03
5e−03
8e−03
1e−02
1e−06 3e−06 5e−06 1e−05 3e−05 5e−05 1e−04 3e−04 5e−04 1e−03 3e−03 5e−03 1e−02
False match rate in men within E. Europe
False match rate in men within E. Asia
Dataset:
Application
Photos
●
●
●
●
●
●
●
●
●
●
●
●
●
●
●
●
●
●
●
●
AU
BG
CH
CN
DE
ES
FR
ID
IN
IS
JP
KR
LI
PT
RU
SG
SK
TW
UK
USA
Figure 10: The scatter plot shows FMR when comparing same-age men within and across three Eastern European coun-
tries (Poland, Russia, Ukraine), against FMR obtained comparing men within and across six East Asian countries (China,
Japan, Korea, Philippines, Thailand and Vietnam). The threshold is fixed for each algorithm to give the FMR noted in the
annotation over white men in the U.S. mugshot database. This is indicated by the vertical and horizontal green lines. The
blue diagonal line y = x is included to show “over/under”. The color code identifies the domicile of the developer - some
multinationals conduct research elsewhere. Training data likewise may originate elsewhere.
Links:
EXEC. SUMMARY
TECH. SUMMARY
False positive: Incorrect association of two subjects 1:1 FMR 1:N FPIR
False negative: Failed association of one subject 1:1 FNMR 1:N FNIR
T 0 → FMR, FPIR → 0
→ FNMR, FNIR → 1

This publication is available free of charge from: https://doi.org/10.6028/NIST.IR.8280
2019/12/19 08:14:00 FRVT - FACE RECOGNITION VENDOR TEST - DEMOGRAPHICS 45
●
●
●
●
●
●
●
●
●
●
●
●
●
●
●
●
●
●
●
●
●
●
●
●
●
●
●
●
●
●
●
●
●
●
●
●
●
●
●
●
●
●
●
●
●
●
●
●
●
●
●
●
●
●
●
●
●
●
●
●
●
●
●
●
●
●
●
●
●
●
●
●
●
●
●
●
●
●
●
●
●
●
●
●
●
●
●
●
●
●
●
●
●
●
●
●
●
●
●
●
●
●
●
●
●
●
●
●
●
●
●
●
●
●
●
●
●
●
●
●
●
●
●
●
●
●
●
●
●
●
●
●
●
●
ulsee_1
synesis_4
camvi_4
intellifusion_1
starhybrid_1
sensetime_1
psl_2
sensetime_2
siat_4
ceiec_2
synesis_5
visionbox_1
saffe_2
camvi_2
f8_1
anke_4
winsense_0
alphaface_1
pixelall_2
anke_3
vion_0
allgovision_0
visionbox_0
x−laboratory_0
siat_2
ceiec_1
nodeflux_2
meiya_1
shu_1
gorilla_3
kneron_3
smilart_3
upc_1
gorilla_2
cyberextruder_2
digitalbarriers_2
cognitec_1
cognitec_0
nodeflux_1
rankone_7
microfocus_2
shaman_1
glory_0
glory_1
toshiba_3
toshiba_2
rankone_6
rokid_0
saffe_1
microfocus_1
isystems_2
iit_1
isystems_1
alchera_0
kedacom_0
lookman_2
intellicloudai_1
alchera_1
iit_0
lookman_4
adera_1
visionlabs_7
visionlabs_6
bm_1
uluface_2
videonetics_1
hr_1
tevian_4
realnetworks_2
imagus_0
realnetworks_3
kakao_2
isap_1
dsk_0
imperial_2
facesoft_0
deepglint_1
deepsea_1
intsysmsu_0
imperial_0
mt_0
anyvision_4
cyberlink_2
incode_4
ntechlab_7
incode_3
anyvision_2
ntechlab_6everai_2
everai_paravision_3
3divi_3
vigilantsolutions_7
via_0
vigilantsolutions_6
3divi_4
veridas_1
veridas_2
amplifiedgroup_1
aware_3
ctbcbank_0
aware_4
yisheng_4
innovatrics_6
innovatrics_4
intellivision_2
yitu_3
tongyi_5
neurotechnology_5
einetworks_0
hik_1
megvii_2
remarkai_0
remarkai_1
itmo_5
megvii_1
dermalog_5
dermalog_6
itmo_6
chtface_1
tech5_3
tech5_2
tiger_3
tiger_2
intelresearch_0
vocord_7
vocord_6
neurotechnology_6
cogent_3
cogent_4
idemia_4
dahua_3
dahua_2
id3_4
id3_3
T set for FMR = 0.000030 in
US mugshots of white men
8e−07
1e−06
2e−06
3e−06
5e−06
8e−06
1e−05
2e−05
3e−05
5e−05
8e−05
1e−04
2e−04
3e−04
5e−04
8e−04
1e−03
2e−03
3e−03
5e−03
8e−03
1e−02
2e−02
3e−02
1e−06 3e−06 5e−06 1e−05 3e−05 5e−05 1e−04 3e−04 5e−04 1e−03 3e−03 5e−03 1e−02
False match rate in women within E. Europe
False match rate in women within E. Asia
Dataset:
Application
Photos
●
●
●
●
●
●
●
●
●
●
●
●
●
●
●
●
●
●
●
●
AU
BG
CH
CN
DE
ES
FR
ID
IN
IS
JP
KR
LI
PT
RU
SG
SK
TW
UK
USA
Figure 11: The scatter plot shows FMR when comparing same-age women within and across three Eastern European
countries (Poland, Russia, Ukraine), against FMR obtained comparing women within and across six East Asian countries
(China, Japan, Korea, Philippines, Thailand and Vietnam). The threshold is fixed for each algorithm to give the FMR noted
in the annotation over white men in the U.S. mugshot database. This is indicated by the vertical and horizontal green lines.
The blue diagonal line y = x is included to show “over/under”. The color code identifies the domicile of the developer -
some multinationals conduct research elsewhere. Training data likewise may originate elsewhere.
Links:
EXEC. SUMMARY
TECH. SUMMARY
False positive: Incorrect association of two subjects 1:1 FMR 1:N FPIR
False negative: Failed association of one subject 1:1 FNMR 1:N FNIR
T 0 → FMR, FPIR → 0
→ FNMR, FNIR → 1

This publication is available free of charge from: https://doi.org/10.6028/NIST.IR.8280
2019/12/19 08:14:00 FRVT - FACE RECOGNITION VENDOR TEST - DEMOGRAPHICS 46
−2.9
−3.2
−4.4
−3.3
−5.1
−4.4
−3.6
−5.5
−3.0
−4.1
−4.8
−4.4
−3.6
−5.2
−4.6
−6.0
−2.2 −3.1
−2.3
−3.5
−3.7
−6.0
−5.4
−4.6
−3.7
−5.1
−4.0
−4.3
−5.1
−4.7
−4.1−4.1
−4.6
−4.5 −4.3
−4.9
−3.6
−3.8
−4.9
−3.8
−5.3
−4.9
−3.9
−5.7
−3.5
−4.5
−6.0
−4.8
−3.8
−5.5
−4.7
−6.0
−2.6 −3.5
−2.6
−3.6
−3.7
−5.1
−5.8
−5.1
−3.8
−4.9
−4.0
−4.6
−5.4
−4.8
−4.2−4.6
−4.7
−4.7 −4.4
−5.1
imperial_002
yitu_003
F−Am. Indian
F−Asian
F−Black
F−White
M−Am. Indian
M−Asian
M−Black
M−White
F−Am. Indian
F−Asian
F−Black
F−White
M−Am. Indian
M−Asian
M−Black
M−White
F−Am. Indian
F−Asian
F−Black
F−White
M−Am. Indian
M−Asian
M−Black
M−White
Demographics of enrollee
Demographics of impostor
−6 −5 −4 −3 −2 −1 0
Dataset: MUGSHOTS log10 FMR
Figure 12: For mugshot photos tagged with one of four race labels and a sex label, the heatmaps show false positive rates for
comparison of randomly selected photos from the groups identified in the respective rows and columns. Two algorithms
are used, one in each panel, and the threshold for each is set to a fixed value everywhere. The value is the smallest
threshold that gives FMR ≤ 0.0001 on the white male imposters. Each cell depicts FMR on a logarithmic scale. The text
value is log
10
(FMR) with large negative values encoding superior false match rates. Annex 6 contains the corresponding
figure for all algorithms.
4.4 Dependence of FMR on race in United States mugshots
Method: Using high quality mugshot portraits from the mugshot images detailed Annex 1 , we apply each
verification algorithm to conduct 3 million comparisons for each of the eight demographics defined by two
sexes and four races. The origin and meaning of these labels is described in the Annex. We executed this set
of comparisons with 126 verification algorithms submitted to the FRVT Verification track. These are listed in
Tables 4-6. We compared scores with a threshold to produce FMR estimates for each demographic pairing.
Each threshold was selected as the lowest value that gave FMR at or below a target FMR. The target FMR
value was 0.0001. The threshold was computed over the set of 3 000 000 mugshot imposter comparisons made
for white males. Thus, by design, the FMR for that demographic is exactly 0.0001.
We excluded photographs for which race or sex was unavailable or unknown. We did not report comparisons
by age-group.
Analysis: As with the international set of application photos, we use the heatmap to show cross-demographic
Links:
EXEC. SUMMARY
TECH. SUMMARY
False positive: Incorrect association of two subjects 1:1 FMR 1:N FPIR
False negative: Failed association of one subject 1:1 FNMR 1:N FNIR
T 0 → FMR, FPIR → 0
→ FNMR, FNIR → 1

This publication is available free of charge from: https://doi.org/10.6028/NIST.IR.8280
2019/12/19 08:14:00 FRVT - FACE RECOGNITION VENDOR TEST - DEMOGRAPHICS 47
false match rates, including cross-sex. Heatmaps for two algorithms are shown in Figure 12. The Figure shows
FMR as a heatmap. It uses a logarithmic scale, so that a FMR of 0.0001 is represented by a color and a text
value of -4, i.e. log to the base 10. Low FMR values are shown in blue. High FMR values are shown in red. A
grey color connotes the target FMR value (log
10
0.0001 = −4). High FMR values present a security concern in
verification applications. Corresponding figures for all algorithms appear in Annex 6
Figure 13 extracts the within-sex and within-race diagonal elements of those figures and summarizes the results
for all algorithms, ordering the result by worst-case FMR elevation.
Discussion: From the figure, and those in the annex, we make a number of observations.
Higher FMR in women: As with application photos, most algorithms give systematically higher false
match rates in women than in men. The magnitude of this difference is lower with mugshots than with
application photos.
Highest FMR in American Indians: First, the highest FMR occurs in images of American Indians
11
. For
the Imperial-002 algorithm featured in Figure 12 the FMR for American Indian women is 0.0068, i.e. a
68 fold increase over the FMR of 0.0001 in white males. In men, the multiple is 47. Why such large
increases occur is not known. One component of the increase may stem from database identity labelling
errors
12
. We discount this possibility because the database has otherwise excellent ground-truth integrity,
supported by fingerprint enrollments.
Higher FMR in Asian and Black women: There are order-of-magnitude increases in FMR in mugshots
of Asian and Black women. Some algorithms developed in China reduce this differential, for example
Yitu-003 in the right panel of Figure 12.
11
The data supplied to NIST tags this group with letter “I” per the EBTS standard which describes this group as “American Indian,
Eskimo, Alaskan native, or a person having origins in any of the 48 contiguous states of the United States or Alaska who maintains
cultural identification through tribal affiliation or community recognition”. In the figures we replace the letter “I” with “American
Indian” to distinguish from subjects from India in the international datasets.
12
Specifically instances of “one person under two IDs” can cause apparent false positives, that are actually true positives.
Links:
EXEC. SUMMARY
TECH. SUMMARY
False positive: Incorrect association of two subjects 1:1 FMR 1:N FPIR
False negative: Failed association of one subject 1:1 FNMR 1:N FNIR
T 0 → FMR, FPIR → 0
→ FNMR, FNIR → 1

This publication is available free of charge from: https://doi.org/10.6028/NIST.IR.8280
2019/12/19 08:14:00 FRVT - FACE RECOGNITION VENDOR TEST - DEMOGRAPHICS 48
● ● ●●
● ● ●●
● ● ●●
●● ●●
●● ●●
●● ●●
●● ●●
● ●●●
● ● ●●
●● ●●
● ● ●●
● ● ●●
● ● ●●
● ●●●
●● ●●
● ● ●●
● ● ●●
● ● ●●
● ● ●●
● ● ●●
● ● ●●
● ● ●●
● ● ●●
● ● ●●
●● ●●
●● ●●
● ● ●●
● ● ●●
● ● ●●
● ● ●●
●● ●●
● ● ●●
● ● ●●
● ● ●●
● ● ●●
●● ●●
● ● ●●
●● ●●
● ● ●●
● ● ●●
● ● ●●
● ● ●●
● ● ●●
● ● ●●
● ● ●●
● ● ●●
● ●●●
● ●●●
● ● ●●
● ● ●●
● ● ●●
● ● ●●
● ● ●●
● ● ●●
● ● ●●
● ●●●
● ● ●●
● ● ●●
● ● ●●
● ● ●●
● ● ●●
● ● ●●
● ● ●●
●● ●●
● ● ●●
● ●●●
● ● ●●
●● ●●
● ●● ●
●●●●
●●●●
●● ●●
● ●●●
● ●●●
● ● ●●
● ● ●●
● ● ●●
● ● ●●
● ● ●●
● ● ●●
●● ●●
● ● ●●
● ● ●●
● ● ●●
● ●●●
● ● ●●
● ● ●●
● ● ●●
● ● ●●
● ● ●●
● ● ●●
●● ●●
● ● ●●
● ● ●●
●● ●●
● ● ●●
● ● ●●
● ● ●●
● ● ●●
● ●●●
● ● ●●
● ● ●●
● ●●●
● ● ●●
●● ●●
● ● ●●
●● ●●
●● ●●
●● ●●
●● ●●
● ●●●
●● ●●
●● ●●
● ● ●●
●● ●●
●● ●●
● ● ●●
●● ●●
●● ●●
●● ●●
●● ●●
●● ●●
● ● ●●
●● ●●
● ● ●●
● ● ●●
●● ●●
●● ●●
●● ●●
●● ●●
●● ●●
●● ●●
●● ●●
●● ●●
● ● ●●
●● ●●
●● ●●
●● ●●
●● ●●
●● ●●
●● ●●
●● ●●
●● ●●
●● ●●
●● ●●
●● ●●
●● ●●
●● ●●
●● ●●
●●●●
● ● ●●
●● ●●
● ● ●●
●● ●●
●● ●●
●● ●●
●● ●●
●● ●●
● ●●●
●● ●●
●● ●●
●● ●●
● ● ●●
●● ●●
●● ●●
●● ●●
●● ●●
●● ●●
● ● ●●
●● ●●
●● ●●
● ●● ●
● ●●●
● ●●●
●● ●●
● ●●●
● ●●●
●● ●●
●● ●●
●● ●●
●● ●●
● ● ●●
●● ●●
●● ●●
●● ●●
●● ●●
●● ●●
● ● ●●
● ● ●●
●● ●●
●● ●●
● ● ●●
●● ●●
● ● ●●
●● ●●
●● ●●
●● ●●
● ● ●●
●● ●●
● ● ●●
● ● ●●
●● ●●
●● ●●
●● ●●
●● ●●
● ●●●
F
M
Developed Elsewhere
Developed in China
3e−05 1e−04 3e−04 1e−03 3e−03 1e−02 3e−02 3e−05 1e−04 3e−04 1e−03 3e−03 1e−02 3e−02
adera_001
realnetworks_003
shaman_001
tevian_005
ntechlab_006
iit_000
tech5_003
anyvision_004
tech5_002
itmo_005
lookman_004
cognitec_000
tevian_004
camvi_004
cognitec_001
ntechlab_007
cogent_004
vigilantsolutions_006
visionlabs_006
imperial_000
vigilantsolutions_007
smilart_003
kakao_002
cyberextruder_002
anyvision_002
cyberextruder_001
vocord_006
cogent_003
rankone_007
intelresearch_000
itmo_006
lookman_002
visionlabs_007
id3_004
toshiba_002
visionbox_000
aware_003
intellivision_001
psl_002
via_000
imagus_000
allgovision_000
everai_002
synesis_005
toshiba_003
imperial_002
f8_001
3divi_003
everai_paravision_003
facesoft_000
intellivision_002
3divi_004
nodeflux_002
innovatrics_004
iit_001
kneron_003
ctbcbank_000
visionbox_001
camvi_002
gorilla_003
neurotechnology_006
isystems_001
cyberlink_002
idemia_004
intsysmsu_000
aware_004
incode_004
innovatrics_006
alchera_001
incode_003
alchera_000
isap_001
amplifiedgroup_001
videonetics_001
intellifusion_001
dsk_000
ceiec_002
hik_001
tongyi_005
shu_001
sjtu_001
yitu_003
deepsea_001
siat_002
upc_001
dahua_003
vion_000
iqface_000
anke_003
intellicloudai_001
ulsee_001
einetworks_000
x−laboratory_000
winsense_000
uluface_002
pixelall_002
mt_000
anke_004
hr_001
remarkai_000
remarkai_001
alphaface_001
yisheng_004
Algorithm
False match rate
erace
●
●
●
●
Asian
Black
Indian
White
Figure 13: For each verification algorithm, the dots give the false match rates for same-sex and same-race imposter com-
parisons. The threshold is set for each algorithm to give FMR = 0.0001 on white males (the purple dots in the right hand
panel). The algorithms are sorted in order of worst case FMR, usually for American Indian women. Algorithms developed
in China appear in the lower panel.
Links:
EXEC. SUMMARY
TECH. SUMMARY
False positive: Incorrect association of two subjects 1:1 FMR 1:N FPIR
False negative: Failed association of one subject 1:1 FNMR 1:N FNIR
T 0 → FMR, FPIR → 0
→ FNMR, FNIR → 1

This publication is available free of charge from: https://doi.org/10.6028/NIST.IR.8280
2019/12/19 08:14:00 FRVT - FACE RECOGNITION VENDOR TEST - DEMOGRAPHICS 49
−5.15
−5.53
−6.00
−6.00
−6.00
−5.71
−6.00
−6.00
−6.00
−6.00
−6.00
−6.00
−6.00
−6.00
−6.00
−6.00
−6.00
−6.00
−5.78
−5.22
−6.00
−6.00
−6.00
−5.68
−4.84
−3.99
−5.00
−6.00
−6.00
−6.00
−4.66
−4.51
−4.78
−5.59
−6.00
−6.00
−4.72
−4.47
−4.86
−5.27
−6.00
−5.75
−4.70
−4.22
−4.40
−6.00
−6.00
−5.02
−4.31
−4.04
−4.10
−4.57
−5.37
−6.00
−6.00
−4.65
−4.37
−4.50
−5.49
−5.91
−5.30
−4.56
−4.12
−4.29
−5.03
−6.00
−5.46
−4.28
−3.56
−3.49
−6.00
−6.00
−5.02
−3.53
−3.02
−3.87
−4.32
−4.73
−5.43
−5.92
−4.58
−4.70
−4.76
−5.20
−6.00
−5.36
−5.17
−4.59
−4.68
−4.89
−6.00
−5.90
−4.73
−4.30
−4.15
−6.00
−6.00
−5.29
−4.26
−3.52
−2.90
−3.35
−4.24
−5.22
−6.00
−3.34
−3.20
−3.53
−4.26
−5.19
−4.25
−3.55
−3.15
−3.37
−4.08
−4.90
−4.31
−3.36
−3.07
−3.23
−5.84
−5.29
−3.98
−3.20
−2.84
−2.79
−3.20
−3.96
−4.66
−5.38
−3.19
−3.15
−3.45
−3.94
−4.91
−3.86
−3.41
−2.96
−3.02
−3.65
−4.62
−4.04
−3.10
−2.68
−2.76
−5.25
−4.96
−3.76
−2.79
−2.22
−3.66
−4.48
−4.97
−6.00
−6.00
−4.95
−4.91
−4.99
−5.50
−5.82
−5.61
−5.16
−5.02
−5.41
−5.91
−6.00
−5.99
−5.19
−4.57
−4.55
−6.00
−6.00
−5.48
−4.32
−3.82
−2.86
−4.05
−4.76
−5.51
−6.00
−4.01
−3.63
−3.74
−4.70
−5.59
−4.79
−3.76
−3.58
−4.05
−4.67
−5.91
−4.69
−4.04
−3.51
−3.59
−6.00
−5.63
−4.79
−3.56
−3.04
−2.82
−3.46
−3.92
−4.65
−4.77
−3.45
−3.18
−3.31
−3.88
−4.64
−3.88
−3.33
−3.12
−3.18
−3.72
−4.75
−3.88
−3.20
−2.34
−2.36
−5.31
−4.66
−3.75
−2.34
−1.96
−3.24
−3.90
−4.25
−4.98
−6.00
−4.33
−4.57
−4.72
−5.42
−6.00
−5.22
−4.76
−4.53
−4.72
−4.53
−6.00
−5.00
−4.45
−4.02
−3.85
−6.00
−5.36
−4.93
−3.63
−3.04
−2.66
−3.78
−4.41
−6.00
−6.00
−3.61
−3.51
−3.57
−4.32
−4.98
−4.36
−3.65
−3.40
−3.60
−4.27
−4.84
−4.18
−3.61
−3.31
−3.26
−6.00
−5.32
−3.86
−3.17
−2.74
−2.32
−3.02
−3.54
−4.08
−3.98
−2.98
−3.01
−3.06
−3.51
−4.28
−3.57
−3.13
−2.90
−2.96
−3.55
−4.14
−3.53
−2.93
−2.29
−2.32
−4.38
−3.94
−3.31
−2.18
−1.87
−4.40
−4.92
−5.43
−5.75
−6.00
−4.90
−4.92
−5.00
−5.36
−5.57
−5.25
−5.09
−4.79
−4.71
−4.87
−5.78
−5.36
−4.72
−4.21
−3.95
−6.00
−5.36
−4.52
−3.68
−3.06
−3.51
−4.15
−4.63
−5.18
−6.00
−4.12
−3.60
−3.65
−4.12
−4.87
−4.63
−3.65
−3.33
−3.50
−4.07
−5.21
−4.12
−3.44
−3.10
−3.19
−6.00
−4.56
−3.91
−3.14
−2.61
−3.14
−3.51
−3.86
−4.58
−5.54
−3.51
−3.19
−3.19
−3.60
−4.24
−3.89
−3.23
−2.92
−3.00
−3.41
−4.31
−3.64
−2.99
−2.50
−2.39
−4.87
−4.48
−3.50
−2.43
−1.86
−3.48
−4.11
−4.72
−4.95
−5.10
−4.11
−4.18
−4.46
−4.72
−5.19
−4.86
−4.50
−4.13
−4.05
−4.36
−5.23
−4.95
−4.21
−3.49
−3.34
−6.00
−5.45
−4.62
−3.37
−2.77
−2.52
−3.06
−3.88
−4.70
−5.33
−3.08
−2.96
−3.27
−3.96
−4.72
−3.96
−3.26
−2.99
−3.18
−3.71
−4.70
−3.94
−3.13
−2.68
−2.70
−5.31
−4.87
−3.73
−2.72
−2.27
−2.63
−3.05
−3.62
−4.07
−4.21
−3.07
−2.90
−3.00
−3.41
−3.92
−3.61
−2.98
−2.56
−2.58
−3.12
−4.06
−3.46
−2.61
−1.95
−1.94
−4.41
−4.14
−3.19
−1.97
−1.47
1_Poland
2_Mexico
6_India
5_Kenya
3_Nigeria
7_China
Male−Female
Male−Male
Female−Female
(12−20]
(20−35]
(35−50]
(50−65]
(65−99]
(12−20]
(20−35]
(35−50]
(50−65]
(65−99]
(12−20]
(20−35]
(35−50]
(50−65]
(65−99]
(12−20]
(20−35]
(35−50]
(50−65]
(65−99]
(12−20]
(20−35]
(35−50]
(50−65]
(65−99]
(12−20]
(20−35]
(35−50]
(50−65]
(65−99]
(12−20]
(20−35]
(35−50]
(50−65]
(65−99]
(12−20]
(20−35]
(35−50]
(50−65]
(65−99]
(12−20]
(20−35]
(35−50]
(50−65]
(65−99]
Demographics of impostor and enrollee
Age group
−6
−5
−4
−3
−2
−1
0
Algorithm:
imperial_002
Threshold:
1.381120
Dataset: Application
Nominal FMR: 0.000030
log10 FMR
reports/11/figures/dhs_obim/cross_country/impostors/heatmap_fmr_age_x_age_special_country/imperial_002.pdf
Figure 14: For six countries selected for the high number of images in the dataset and from distinct regions the heatmaps
show cross-age false match rates for imposters of the same sex from the age groups given on the respective axes. Each cell
depicts FMR on a logarithmic scale. The text value is log
10
(FMR) with large negative values encoding superior false match
rates. Annex 9 contains the corresponding figure for all algorithms.
4.5 Do some or all algorithms yield more false positives on certain age groups
Method: Using high quality application portraits drawn from the corpus described in Annex 2 , we compared
442 019 images from 24 countries with 441 517 images of different individuals within and across age groups
(00 − 20], (20 − 35], (35 − 50], (50 − 65], and (65 − 99].
We executed this set of comparisons with 126 verification algorithms submitted to the FRVT Verification track.
These are listed in Tables 4-6. Each comparison yield a score. When many scores are compared with a fixed
threshold, we obtain an estimate of the false match rate. The threshold was computed over a set of 93 070 400
imposter comparisons made using a different set of images, namely the mugshots detailed in Annex 1 . The
threshold is the smallest value that for which the FMR is less than or equal to 0.00003. This was repeated for
other thresholds giving FMR {0.000001, 0.000003, 0.00001, 0.00003, 0.0001, 0.0003, 0.001, 0.003, 0.01, 0.03}.
Each comparison is accompanied by sex, country of birth and age group metadata for the two individuals
represented in the photographs. We excluded small numbers of photographs for which age information was
unavailable or for which sex was not listed as male or female.
Given many comparisons with the same demographic pairing, we can produce a measurement of FMR when
comparing individuals from two age groups, for example Polish men over the age of 65 with Polish men under
20.
Links:
EXEC. SUMMARY
TECH. SUMMARY
False positive: Incorrect association of two subjects 1:1 FMR 1:N FPIR
False negative: Failed association of one subject 1:1 FNMR 1:N FNIR
T 0 → FMR, FPIR → 0
→ FNMR, FNIR → 1

This publication is available free of charge from: https://doi.org/10.6028/NIST.IR.8280
2019/12/19 08:14:00 FRVT - FACE RECOGNITION VENDOR TEST - DEMOGRAPHICS 50
−2.0
−3.8
−5.0
−5.3
−5.5
−5.7
−5.9
−5.7
−2.8
−6.0
−6.0
−6.0
−6.0
−6.0
−3.6
−3.0
−3.7
−4.2
−4.5
−4.6
−4.8
−4.9
−2.9
−5.2
−5.3
−5.3
−5.5
−6.0
−4.8
−3.8
−3.8
−4.0
−4.2
−4.3
−4.5
−4.6
−4.1
−4.9
−5.1
−5.4
−5.9
−6.0
−5.1
−4.2
−4.0
−4.0
−4.0
−4.1
−4.3
−4.4
−4.5
−4.7
−5.0
−5.3
−5.7
−6.0
−5.4
−4.4
−4.1
−4.1
−3.9
−4.0
−4.1
−4.2
−4.7
−4.5
−4.8
−5.1
−5.5
−5.9
−5.5
−4.6
−4.2
−4.1
−4.0
−4.0
−4.0
−4.0
−5.0
−4.2
−4.5
−4.9
−5.3
−5.6
−5.5
−4.7
−4.4
−4.3
−4.1
−4.0
−3.9
−3.9
−5.1
−4.0
−4.2
−4.6
−4.9
−5.4
−5.4
−4.9
−4.5
−4.4
−4.2
−4.1
−3.9
−3.8
−5.1
−3.9
−3.9
−4.3
−4.7
−5.0
−2.7
−3.1
−4.1
−4.6
−4.9
−5.0
−5.3
−5.2
−2.5
−5.6
−5.7
−5.7
−5.9
−6.0
−5.7
−5.1
−4.7
−4.6
−4.4
−4.2
−4.0
−3.8
−5.4
−3.7
−3.7
−3.8
−4.1
−4.6
−6.0
−5.5
−5.1
−5.0
−4.7
−4.5
−4.2
−4.0
−5.6
−3.8
−3.4
−3.4
−3.5
−3.9
−5.8
−5.6
−5.4
−5.2
−5.1
−4.8
−4.6
−4.3
−5.8
−4.0
−3.4
−3.2
−3.2
−3.4
−6.0
−5.7
−5.8
−5.4
−5.4
−5.2
−4.9
−4.6
−5.8
−4.2
−3.5
−3.1
−3.0
−3.0
−6.0
−6.0
−6.0
−6.0
−5.9
−5.6
−5.3
−4.9
−6.0
−4.6
−3.7
−3.2
−3.0
−2.8
−1.6
−3.4
−4.3
−4.8
−4.9
−5.1
−5.3
−5.1
−2.3
−5.5
−5.4
−5.8
−5.9
−6.0
−3.1
−2.4
−3.0
−3.5
−3.7
−3.8
−4.1
−4.1
−2.3
−4.5
−4.8
−4.6
−4.7
−5.3
−4.2
−3.1
−3.0
−3.2
−3.3
−3.4
−3.6
−3.7
−3.5
−4.0
−4.3
−4.6
−5.3
−5.2
−4.5
−3.4
−3.1
−3.2
−3.1
−3.2
−3.4
−3.5
−3.9
−3.8
−4.1
−4.4
−4.8
−5.7
−4.8
−3.6
−3.2
−3.2
−3.0
−3.1
−3.1
−3.3
−4.0
−3.5
−3.8
−4.2
−4.6
−5.0
−4.9
−3.8
−3.3
−3.3
−3.1
−3.0
−3.0
−3.1
−4.3
−3.3
−3.5
−4.0
−4.4
−4.6
−4.8
−3.9
−3.5
−3.4
−3.2
−3.1
−3.0
−2.9
−4.4
−3.1
−3.3
−3.7
−4.1
−4.6
−5.3
−4.2
−3.7
−3.5
−3.3
−3.1
−2.9
−2.9
−4.5
−3.0
−3.1
−3.4
−3.8
−4.0
−2.2
−2.5
−3.4
−4.0
−4.2
−4.3
−4.7
−4.5
−1.9
−5.0
−5.0
−5.1
−5.1
−6.0
−5.5
−4.4
−3.8
−3.8
−3.5
−3.3
−3.1
−2.9
−4.7
−2.9
−2.8
−3.0
−3.3
−3.7
−5.5
−4.8
−4.2
−4.1
−3.8
−3.5
−3.3
−3.0
−5.0
−2.8
−2.5
−2.5
−2.7
−3.0
−5.8
−5.0
−4.6
−4.5
−4.2
−3.9
−3.7
−3.4
−5.2
−3.1
−2.5
−2.3
−2.3
−2.6
−5.5
−5.1
−5.0
−4.6
−4.5
−4.3
−4.0
−3.7
−5.4
−3.3
−2.6
−2.2
−2.1
−2.2
−6.0
−6.0
−5.5
−5.2
−5.0
−4.7
−4.5
−4.0
−5.6
−3.7
−2.9
−2.4
−2.2
−2.0
All impostor pairs
Same sex and same region impostor pairs
(0,4]
(04,10)
(10,16]
(16,20]
(20,24]
(24,28]
(28,32]
(32,36]
(36,40]
(40,48]
(48,56]
(56,64]
(64,72]
(72,120]
(0,4]
(04,10)
(10,16]
(16,20]
(20,24]
(24,28]
(28,32]
(32,36]
(36,40]
(40,48]
(48,56]
(56,64]
(64,72]
(72,120]
(0,4]
(04,10)
(10,16]
(16,20]
(20,24]
(24,28]
(28,32]
(32,36]
(36,40]
(40,48]
(48,56]
(56,64]
(64,72]
(72,120]
Age of enrollee
Age of impostor
−6 −5 −4 −3 −2 −1
Cross age FMR at threshold T = 1.358 for algorithm imperial_002, giving
FMR(T) = 0.0001 globally. log10 FMR
Figure 15: For visa photos from all countries, the heatmap shows for one algorithm cross-age false match rates for imposters
of the same sex. Each cell depicts FMR on a logarithmic scale. The text value is log
10
(FMR) with large negative values
encoding superior false match rates. The threshold is fixed to the value that gives a FMR of 0.0001 over all zero-effort
imposter pairs. Annex 10 contains the corresponding figure for all algorithms.
Links:
EXEC. SUMMARY
TECH. SUMMARY
False positive: Incorrect association of two subjects 1:1 FMR 1:N FPIR
False negative: Failed association of one subject 1:1 FNMR 1:N FNIR
T 0 → FMR, FPIR → 0
→ FNMR, FNIR → 1

This publication is available free of charge from: https://doi.org/10.6028/NIST.IR.8280
2019/12/19 08:14:00 FRVT - FACE RECOGNITION VENDOR TEST - DEMOGRAPHICS 51
Analysis: To address the issue of age we produced figures depicting cross-age false match rates. We do this
within-country only, as cross-country effects have been covered in section 4.3. We include male-male, female-
female, and also male-female comparisons (although they are of less interest operationally). Figure 14 is an
example, showing results for one of the more accurate algorithms. The Figure includes results for six countries,
one per region. We dropped one region (the Caribbean) and 18 of the 24 countries because the effects are similar
everywhere.
Figure 14 shows cross-age group FMR for one of the more accurate algorithms. Annex 9 contains correspond-
ing Figures for all algorithms, and therefore extends to more than 130 pages.
Discussion: From Figure 14 and those in the annex, we make these observations.
Lower FMR for persons in different groups: In almost all cases - for all algorithms, countries of origin
and both sexes, comparison of images of persons in different age groups yields lower (better) false match
rates than for persons in the same age group. This, obviously, is an aggregate result; it will generally be
possible to find some individuals from different age groups who produce high imposter scores but this
will be increasingly difficult as the age difference increases.
Highest FMR in the oldest age group: For women from all most countries, comparison of images of
individuals in the 65-and-over age group produce the highest false match rates. For men this is often
true also.
High FMR in the youngest age group: For both sexes, but men in particular, comparison of images of
persons in the 12−20 age group produce high false match rates. The dataset does not include any subjects
below 12. Below that age we consider a smaller dataset of visa photographs (see Annex 3 ) that includes
individuals in age groups (0, 4] and (4, 10]. The results are included in the heatmap of Figure 15. Note
that each FMR estimate is formed from comparisons from all countries, not just one, so they hide the
geographic idiosyncrasies of the algorithms.
These results are similar to those reported by Michalski et al. [28] for false positives in children using
one commercial algorithm. The report also shows false negative ageing effects broken out by age at
enrolment, and time lapse.
Lower FMR across sex: Comparison of images of persons of different sex usually produces very low
FMR. However, within the youngest and oldest age groups, FMR is again higher and substantially above
the nominal FMR.
Links:
EXEC. SUMMARY
TECH. SUMMARY
False positive: Incorrect association of two subjects 1:1 FMR 1:N FPIR
False negative: Failed association of one subject 1:1 FNMR 1:N FNIR
T 0 → FMR, FPIR → 0
→ FNMR, FNIR → 1

This publication is available free of charge from: https://doi.org/10.6028/NIST.IR.8280
2019/12/19 08:14:00 FRVT - FACE RECOGNITION VENDOR TEST - DEMOGRAPHICS 52
−3.05 −2.33−2.99−3.26 −2.82−3.26−3.42 −3.02−3.34 −2.32 −2.38−2.89−2.79 −3.14−3.36 −2.81−3.10−4.10 −4.42 −2.63 −2.75 −1.60−2.54−4.03
−3.29 −2.49−2.99−3.35 −3.18−3.39−3.50 −3.03−3.57 −3.01 −2.92−3.10−3.15 −3.19−3.50 −2.89−3.41−4.37 −4.44 −2.90 −2.77 −1.52−3.08−4.37
−2.94 −2.38−2.70−3.02 −3.12−3.06−3.31 −2.68−3.37 −2.90 −2.55−2.92−2.96 −2.92−3.20 −2.56−3.08−4.12 −4.14 −2.56 −2.27 −1.31−2.71−4.05
−2.58 −1.90−2.47−2.51 −2.34−2.64−2.86 −2.31−2.97 −2.29 −2.07−2.57−2.68 −2.50−2.77 −2.12−2.49−3.56 −3.62 −1.95 −1.76 −0.98−2.19−3.54
−2.05 −1.52−1.93−2.01 −1.96−2.20−2.38 −1.93−2.42 −1.87 −1.63−1.96−2.22 −1.86−2.46 −1.62−1.97−3.02 −3.11 −1.47 −1.38 −0.78−1.70−2.90
−3.14 −2.58−3.32−3.44 −2.86−3.41−3.36 −2.75−3.53 −2.66 −2.37−3.34−2.90 −3.51−3.37 −2.56−3.24−3.99 −3.83 −2.52 −2.58 −2.01−2.49−3.97
−3.46 −3.01−3.42−3.94 −3.63−3.90−3.82 −3.19−4.02 −3.51 −2.81−3.66−3.20 −3.60−3.63 −2.91−3.86−4.51 −4.50 −2.96 −2.90 −2.12−3.05−4.52
−3.40 −2.88−3.21−3.64 −3.58−3.77−3.86 −3.05−3.93 −3.40 −2.97−3.36−3.15 −3.33−3.64 −2.89−3.79−4.47 −4.67 −2.99 −2.83 −2.17−3.14−4.44
−3.17 −2.69−3.09−3.20 −3.51−3.57−3.65 −2.93−3.50 −3.31 −2.82−3.09−3.07 −3.10−3.46 −2.80−3.65−4.22 −4.32 −2.68 −2.44 −2.06−2.91−4.36
−2.88 −2.36−2.97−2.67 −3.04−3.06−3.25 −2.57−2.97 −2.74 −2.33−2.58−2.84 −2.61−3.14 −2.34−2.98−4.04 −4.32 −2.27 −1.98 −1.82−2.42−3.88
M
F
1_Poland
1_Russia
1_Ukraine
6_Iran
2_Nicaragua
4_Jamaica
6_Iraq
2_Mexico
2_El_Salvador
6_Pakistan
4_Haiti
6_India
3_Liberia
3_Ghana
3_Nigeria
7_Japan
5_Kenya
7_Thailand
7_Phillippines
7_Korea
5_Ethiopia
7_China
7_Vietnam
5_Somalia
(12−20]
(20−35]
(35−50]
(50−65]
(65−99]
(12−20]
(20−35]
(35−50]
(50−65]
(65−99]
Demographics of impostor and enrollee
Age group
−6 −5 −4 −3 −2 −1 0
Algorithm: imperial_002 Threshold: 1.381120 Dataset: Application Nominal FMR: 0.000030 log10 FMR
Impostors have same sex, age and country of birth
reports/11/figures/dhs_obim/cross_country/impostors/heatmap_fmr_age_x_country/imperial_002.pdf
Figure 16: For application photos, the The heatmap shows one-to-one false match rates for same-sex, same-age and same-country of birth imposters, broken out
by age and country. The text value is log
10
(FMR) with large negative values encoding superior false match rates. Each cell depicts FMR on a logarithmic scale.
The text value is log
10
(FMR) with large negative values encoding superior false match rates. Annex 11 contains the corresponding figure for all algorithms.
Links:
EXEC. SUMMARY
TECH. SUMMARY
False positive: Incorrect association of two subjects 1:1 FMR 1:N FPIR
False negative: Failed association of one subject 1:1 FNMR 1:N FNIR
T 0 → FMR, FPIR → 0
→ FNMR, FNIR → 1

This publication is available free of charge from: https://doi.org/10.6028/NIST.IR.8280
2019/12/19 08:14:00 FRVT - FACE RECOGNITION VENDOR TEST - DEMOGRAPHICS 53
5 False negative differentials in verification
5.1 Introduction
False negatives occur in biometric systems when samples from one individual yield a comparison score below
a threshold. This will occur when the features extracted from two input photographs are insufficiently similar.
Recall that face recognition is implemented as a differential operator: two samples are analyzed and compared.
So a false negative occurs when two from the same face appear different to the algorithm.
5.2 Tests
This section gives empirical quantification of the variation in false negative rates across demographics. We
base this on recognition results from three one-to-one verification tests:
Mugshot - Mugshot: In the first test we look for demographic effects in the groups defined by the sex
and race labels provided with these United States images - see Annex 1 .
Application - Application photo: We consider also a high quality dataset collected from subjects hailing
from twenty four countries in seven global regions.
Application - Border crossing photo: As discussed in Annex 4 , the border crossing photos are collected
under time constraints, in high volume immigration environments. The photos there present classic pose
and illumination challenges to algorithms.
5.3 Metrics
The metrics appropriate to verification have been detailed in section 3.1. These are related to particular ap-
plications in Figure 2. The dicussion in subsequent sections centers on false non-match rates at particular
thresholds, i.e. FNMR(T ).
5.4 Results
Figure 17 summarizes the false non-match rates for the 52 most accurate algorithms comparing mugshot pho-
tos. It does this for each of four race categories and two sexes
13
. Figure 18 takes the same approach but for 20
countries of birth and two age groups (over/under 45). It summarizes comparison of high quality immigration
13
See Annex 1 for descriptions of the images and metadata.
Links:
EXEC. SUMMARY
TECH. SUMMARY
False positive: Incorrect association of two subjects 1:1 FMR 1:N FPIR
False negative: Failed association of one subject 1:1 FNMR 1:N FNIR
T 0 → FMR, FPIR → 0
→ FNMR, FNIR → 1

This publication is available free of charge from: https://doi.org/10.6028/NIST.IR.8280
2019/12/19 08:14:00 FRVT - FACE RECOGNITION VENDOR TEST - DEMOGRAPHICS 54
Black
White
Asian
Indian
0.00 0.01 0.02 0.03 0.04
False non−match rate (FNMR): Distribution over 52 most accurate algorithms
Race
Dataset: MUGSHOT FMR: 0.000010 Sex:
Female Male
reports/11/figures/fbi/ngi/for_fmr/fnmr_by_sex_age_country_all_algorithms.pdf
Figure 17: For mugshot comparisons, the figure shows the distribution of FNMR values over the 52 most accurate verifi-
cation algorithms, by sex and race. The threshold was set for each algorithm to achieve FMR = 0.00001 over all imposter
comparisons. The line within each box is the median over those algorithms; the box itself spans the interquartile range
(26 algorithms) and the lines here extend to minimum and maximum values. The small box on the left side indicates the
accuracy for best algorithm overall, on this dataset alphaface-001.
application photos with lower quality border crossing photos. These are described in Annex 2 and Annex 4
respectively.
We make the following observations.
FNMR is absolutely low: In one-to-one verification of mugshots, the best algorithms give FNMR below
0.5% at the reasonably stringent FMR criterion of 0.00001. FNMR is generally below 1% with exceptions
discussed below. For the more difficult application-border crossing comparisons, the best algorithm
almost always gives FNMR below 1%. These error rates are far better than the gender-classification error
rates that spawned widespread coverage of bias in face recognition. In that study [5], two algorithms
assigned the wrong gender to black females almost 35% of the time. The recognition error rates here, even
from middling algorithms, are an order of magnitude lower. Thus, to the extent there are demographic
differentials, they are much smaller than those that (correctly) motivated criticisms of the 2017-era gender
classification algorithms.
FNMR in African and African American subjects: In domestic mugshots, the lowest FNMR in images of
subjects whose race is listed as black. However, when comparing high-quality appliction photos with
border-crossing images, FNMR is often highest in African born subjects. We don’t formally measure
contrast or brightness in order to determine why this occurs, but inspection of the border quality images
shows underexposure of dark skinned individuals often due to bright background lighting in the border
crossing environment. In mugshots this does not occur. In neither case is the camera at fault.
Links:
EXEC. SUMMARY
TECH. SUMMARY
False positive: Incorrect association of two subjects 1:1 FMR 1:N FPIR
False negative: Failed association of one subject 1:1 FNMR 1:N FNIR
T 0 → FMR, FPIR → 0
→ FNMR, FNIR → 1

This publication is available free of charge from: https://doi.org/10.6028/NIST.IR.8280
2019/12/19 08:14:00 FRVT - FACE RECOGNITION VENDOR TEST - DEMOGRAPHICS 55
<=45
>45
0.00 0.01 0.02 0.03 0.04
6_Iraq
2_El_Salvador
7_China
5_Ethiopia
7_Thailand
7_Phillippines
2_Nicaragua
7_Japan
7_Vietnam
6_Iran
2_Mexico
7_Korea
6_Pakistan
1_Ukraine
1_Poland
3_Ghana
1_Russia
4_Jamaica
6_India
3_Nigeria
4_Haiti
3_Liberia
5_Somalia
5_Kenya
6_Iraq
2_El_Salvador
7_China
5_Ethiopia
7_Thailand
7_Phillippines
2_Nicaragua
7_Japan
7_Vietnam
6_Iran
2_Mexico
7_Korea
6_Pakistan
1_Ukraine
1_Poland
3_Ghana
1_Russia
4_Jamaica
6_India
3_Nigeria
4_Haiti
3_Liberia
5_Somalia
5_Kenya
False non−match rate (FNMR): Distribution over 52 most accurate algorithms
Country of birth
Dataset: Application vs. Border Crossing FMR: 0.000010 Sex:
Female Male
reports/11/figures/dhs_obim/entry_to_visa/fnmr_by_sex_age_country_all_algorithms.pdf
Figure 18: For the application - border crossing photo comparisons, the boxplots show the distribution of FNMR values
over the 52 most accurate algorithms, by sex, country of birth, and age group. The threshold was set for each algorithm to
achieve FMR = 0.00001 over all imposter comparisons. The line within each box is the median over those algorithms; the
box itself spans the interquartile range (26 algorithms) and the lines here extend to minimum and maximum values. The
small box on the left side indicates the accuracy for best algorithm overall, on this dataset visionlabs-007.
Links:
EXEC. SUMMARY
TECH. SUMMARY
False positive: Incorrect association of two subjects 1:1 FMR 1:N FPIR
False negative: Failed association of one subject 1:1 FNMR 1:N FNIR
T 0 → FMR, FPIR → 0
→ FNMR, FNIR → 1

This publication is available free of charge from: https://doi.org/10.6028/NIST.IR.8280
2019/12/19 08:14:00 FRVT - FACE RECOGNITION VENDOR TEST - DEMOGRAPHICS 56
●
●
●
●
●
●
●
●
0.001
0.002
0.003
0.005
0.008
0.010
0.020
0.030
0.050
5e−06 1e−05 2e−053e−05 5e−05 1e−04 2e−043e−04 5e−04 1e−03 2e−033e−03 5e−03 1e−02 2e−023e−02 5e−02 1e−01
False match rate (FMR)
False non−match rate (FNMR)
sex
Female
Male
FMR_white_male
●
FMR = 0.00001 at
T = 1.3977
FMR = 0.00010 at
T = 1.3466
FMR = 0.00100 at
T = 1.2860
Dataset:
MUGSHOT
Algorithm:
imperial_002
Am. Indian
Asian
Black
White
Figure 19: For one algorithm verifying mugshot images, the error tradeoff characteristics show false non-match vs. false
match rates. The FMR estimates are computed for same-sex and same-race imposter comparisons. Each symbol (circle, tri-
angle, square) corresponds to a fixed threshold - their vertical and horizontal displacements reveal, respectively, differences
in FNMR and FMR between demographic groups. The vertical line through each symbol indicates uncertainty related to
sample size - it spans 95% of bootstrap samples of the genuine scores. Annex 12 contains the corresponding figure for all
algorithms.
Women give higher FNMR: In most cases, algorithms give higher false non-match rates in women than
men. Note that this is a marginal effect - perhaps 98% of women are still correctly verified - so the
effect is confined to fewer than 2% of comparisons where algorithms fail to verify. It is possible that the
error differences are due to relative prevalence some unknown covariate. There are some exceptions,
however: In Kenya, Nigeria, Jamaica men give higher FNMR. This applies in Haiti and Ghana also but
only for people aged 45 or over.
These aggregations of results over a large number of algorithms is intended to expose coarse differences be-
tween demographic groups. In so doing it hides that certain algorithms may differ from the trends evident in
the Figure. Full error tradeoff characteristics appear in Annex 12 .
The false negative results for law enforcement images apply to high quality mugshots, collected with deliberate
consideration of standards. When image quality degrades, false negatives are expected to increase. We next
consider results for the comparison of high quality Annex 2 application reference photos with Annex 4 border
crossing images collected in a less controlled environment under some (implicit) time constraint. We report
Links:
EXEC. SUMMARY
TECH. SUMMARY
False positive: Incorrect association of two subjects 1:1 FMR 1:N FPIR
False negative: Failed association of one subject 1:1 FNMR 1:N FNIR
T 0 → FMR, FPIR → 0
→ FNMR, FNIR → 1

This publication is available free of charge from: https://doi.org/10.6028/NIST.IR.8280
2019/12/19 08:14:00 FRVT - FACE RECOGNITION VENDOR TEST - DEMOGRAPHICS 57
reports/11/figures/fbi/ngi/for_fmr/score_violins/imperial_002.pdf
0.0170 0.0143 0.0036 0.0077
0.0121 0.0051 0.0021 0.0062
Female
Male
Am. Indian Asian Black White Am. Indian Asian Black White
0.75
1.00
1.25
1.50
1.75
2.00
Race
Genuine similarity score
0.004
0.008
0.012
0.016
Algorithm:
imperial_002
Threshold:
1.437290
FNMR
−3.3 −4.4 −4.6 −5.0
−3.6 −4.8 −5.0 −5.0
Female
Male
Am. Indian Asian Black White Am. Indian Asian Black White
0.8
1.0
1.2
1.4
1.6
Race
Nonmate Similarity Score
−5
−4
−3
−2
FMR
Figure 20: For one algorithm verifying mugshots, the violin plots show native similarity score distributions. The horizontal
line shows the threshold that gives FMR = 0.0001 over all the imposter pairs. The imposters have the same sex and race.
The upper figure shows genuine scores and the color indicates FNMR at the given threshold on a linear scale. The lower
figure shows imposter scores with color indicating FMR on a logarithmic scale. FMR values below 10
−5
are pinned to that
value. Annex 15 contains the corresponding figure for all algorithms.
Links:
EXEC. SUMMARY
TECH. SUMMARY
False positive: Incorrect association of two subjects 1:1 FMR 1:N FPIR
False negative: Failed association of one subject 1:1 FNMR 1:N FNIR
T 0 → FMR, FPIR → 0
→ FNMR, FNIR → 1

This publication is available free of charge from: https://doi.org/10.6028/NIST.IR.8280
2019/12/19 08:14:00 FRVT - FACE RECOGNITION VENDOR TEST - DEMOGRAPHICS 58
results in two ways:
Per algorithm: Annex 14 shows FNMR by country of birth for two sexes and two age groups (above and
below age 45).
As Figure 22 heatmap showing results for all algorithms and all countries of birth. Each FNMR is the
arithmetic mean of the four FNMR estimates for male and female and age over and under 45. The rows
of the figure are sorted in order of mean FNMR, the mean being taken over all twenty four countries.
The columns of the figure are sorted in order of mean FNMR from the 50 most accurate algorithms - this
statistic was chosen so that high FNMR estimates from poor algorithms did not skew the results.
From these figure we note the following:
• Wide variation across algorithms: False non-match rates range from near 0.1% up to above 10%. This
two-orders-of-magnitude range shows that some algorithms are intolerant of the quality problems in-
herent in the image the border crossing images. These problems are: low contrast, non-centered and
cropped faces, non-frontal pose, and poor resolution, in part due to poor compression.
• The most accurate algorithms give low FNMR: The most accurate algorithms given FNMR below 1%
for almost all countries and demographic groups. For example, the Visionlabs-007 algorithm has outliers
only for Liberian and Somali women under the age of 45, for whom FNMR is below 1.4%.
• Lower variation across countries: For the more accurate algorithms, false non-match rates generally
range by a factor of two or three from the left side of Figure 22 to the right i.e. FNMR in El Salvador is
almost always lower than that in Somalia.
• No clear patterns by age and sex: By considering the Figures of Annex 14 , the differences between the
over- and under-45s is often small, varies by country and by algorithm. However, broad statements do
not mean that certain algorithms do not exhibit demographic differentials.
• Higher FNMR in subjects from Africa and the Caribbean: The heatmap is constructed with countries
appearing in order of the mean FNMR over the fifty most accurate algorithms. This reveals higher FNMR
in Africa and the Caribbean. After those two regions, the next highest FNMR is in the Eastern Europe
countries.
The low error rates stem from efforts over the last decade to train algorithms that are invariant to nuisance
variables such as non-frontal pose and poor contrast. The absolute magnitude of FNMR drives inconvenience.
In many applications, any subject experiencing a false rejection could make a second attempt at recognition.
Links:
EXEC. SUMMARY
TECH. SUMMARY
False positive: Incorrect association of two subjects 1:1 FMR 1:N FPIR
False negative: Failed association of one subject 1:1 FNMR 1:N FNIR
T 0 → FMR, FPIR → 0
→ FNMR, FNIR → 1

This publication is available free of charge from: https://doi.org/10.6028/NIST.IR.8280
2019/12/19 08:14:00 FRVT - FACE RECOGNITION VENDOR TEST - DEMOGRAPHICS 59
Female
Male
1_Poland
1_Russia
1_Ukraine
2_El_Salvador
2_Mexico
2_Nicaragua
3_Ghana
3_Liberia
3_Nigeria
4_Haiti
4_Jamaica
5_Ethiopia
5_Kenya
5_Somalia
6_India
6_Iran
6_Iraq
6_Pakistan
7_China
7_Japan
7_Korea
7_Phillippines
7_Thailand
7_Vietnam
1_Poland
1_Russia
1_Ukraine
2_El_Salvador
2_Mexico
2_Nicaragua
3_Ghana
3_Liberia
3_Nigeria
4_Haiti
4_Jamaica
5_Ethiopia
5_Kenya
5_Somalia
6_India
6_Iran
6_Iraq
6_Pakistan
7_China
7_Japan
7_Korea
7_Phillippines
7_Thailand
7_Vietnam
0.00
0.01
0.02
0.03
Country of birth
False non−match rate (FNMR)
Dataset:
Application vs. Border Crossing
Algorithm imperial_002
FMR 0.000010
Threshold 1.385590
<=45
>45
reports/11/figures/dhs_obim/entry_to_visa/fnmr_by_sex_age_country/imperial_002.pdf
Figure 21: For 24 countries the figure shows false negative rates when the reference algorithm is used to compare two
photos of subjects from the countries identified in the respective columns. The square box gives the median false non-match
rate computed over 2000 bootstrap resamples of the genuine scores. The ends of the line span 95% of those re-samples,
thereby giving a measure of uncertainty in the FNMR estimate. The threshold is set to a fixed value everywhere; it is the
lowest value that gives FMR ≤ 0.00001. Annex 14 contains the corresponding figure for all algorithms.
Why these effects occur would require some multivariate analysis of image- and subject-specific properties.
We suggest that analysis might start with measurement of image related quantities from the digital images to
include such as contrast, intensity, areas of over and under exposure, presence of cropping, and head orienta-
tion. For tools, mixed-effects regression models could be an initial starting point [4] but such work would need
to address correlation between quantities such race and contrast. We have not yet initiated such work and it
is possible that such analysis would be incomplete due to influential but unknown covariates. In particular,
given the border crossing images were collected with cameras mounted at fixed height and are steered by the
immigration officer toward the face it is possible that subject height influences genuine matching scores. For
example very tall subjects might be subject be underexposed because strong ceiling lights in the background
might cause underexposure. Inspection of failure cases invariably leads to insight in such cases. We have not
yet conducted that work.
Links:
EXEC. SUMMARY
TECH. SUMMARY
False positive: Incorrect association of two subjects 1:1 FMR 1:N FPIR
False negative: Failed association of one subject 1:1 FNMR 1:N FNIR
T 0 → FMR, FPIR → 0
→ FNMR, FNIR → 1

This publication is available free of charge from: https://doi.org/10.6028/NIST.IR.8280
2019/12/19 08:14:00 FRVT - FACE RECOGNITION VENDOR TEST - DEMOGRAPHICS 60
−1.4 −1.5−1.4−1.7 −1.5−1.6 −1.3 −1.2−1.3 −1.2−1.3−1.5 −1.3 −1.3−1.5−1.6−1.7 −1.6−1.7 −1.6−1.6−1.7 −1.7−1.8
−1.9 −1.9−1.9−2.1 −1.9−2.1 −1.6 −1.5−1.5 −1.5−1.6−1.9 −1.6 −1.5−1.8−2.0−2.1 −1.9−2.0 −2.0−2.0−2.1 −2.1−2.0
−1.0 −1.1−1.0−1.2 −1.1−1.1 −1.0 −1.0−1.0 −0.9−1.0−1.2 −1.0 −1.1−1.3−1.3−1.4 −1.3−0.9 −0.8−0.8−1.0 −0.9−1.0
−2.0 −2.0−2.0−2.3 −2.1−2.2 −1.9 −1.8−1.9 −1.8−1.9−2.1 −1.9 −1.9−2.0−2.1−2.2 −2.1−2.2 −2.1−2.1−2.2 −2.1−2.2
−1.9 −1.9−1.9−2.2 −1.9−2.1 −1.6 −1.6−1.6 −1.5−1.6−1.9 −1.6 −1.7−1.8−2.0−2.0 −1.9−2.0 −1.9−2.0−2.1 −2.1−2.1
−1.8 −1.8−1.8−2.1 −1.9−2.0 −1.6 −1.6−1.6 −1.5−1.5−1.8 −1.6 −1.6−1.8−1.9−2.0 −1.8−2.0 −1.9−1.9−2.1 −2.0−2.0
−2.3 −2.3−2.3−2.5 −2.3−2.4 −2.3 −2.1−2.2 −2.2−2.3−2.4 −2.2 −2.0−2.1−2.3−2.3 −2.2−2.4 −2.3−2.3−2.4 −2.4−2.4
−0.2 −0.2−0.2−0.2 −0.2−0.1 −0.2 −0.2−0.2 −0.2−0.2−0.1 −0.2 −0.1−0.2−0.2−0.2 −0.2−0.5 −0.4−0.5−0.3 −0.3−0.4
−2.1 −2.1−2.1−2.4 −2.2−2.3 −2.0 −2.0−2.0 −2.0−2.0−2.2 −2.0 −1.9−2.1−2.2−2.3 −2.2−2.3 −2.1−2.2−2.3 −2.2−2.3
−2.2 −2.1−2.2−2.5 −2.3−2.4 −2.1 −2.1−2.1 −2.1−2.1−2.3 −2.0 −1.9−2.1−2.3−2.4 −2.3−2.3 −2.2−2.2−2.3 −2.3−2.4
−2.1 −2.0−2.1−2.3 −2.1−2.2 −1.8 −1.8−1.8 −1.8−1.9−2.1 −1.8 −1.8−2.0−2.2−2.2 −2.1−2.2 −2.1−2.1−2.2 −2.2−2.2
−1.0 −1.1−1.0−1.2 −1.1−1.1 −1.1 −1.0−1.0 −0.9−1.0−1.1 −1.1 −1.0−1.2−1.2−1.2 −1.2−1.3 −1.1−1.1−1.3 −1.3−1.3
−1.1 −1.2−1.1−1.5 −1.3−1.3 −1.3 −1.1−1.2 −1.1−1.2−1.3 −1.2 −1.3−1.4−1.4−1.4 −1.4−1.4 −1.2−1.3−1.5 −1.4−1.5
−0.8 −0.9−0.8−1.1 −1.1−1.0 −0.7 −0.7−0.7 −0.7−0.7−1.0 −0.8 −0.9−1.0−1.0−1.2 −1.0−1.0 −0.9−0.9−1.1 −1.0−1.0
−0.3 −0.3−0.3−0.4 −0.3−0.3 −0.2 −0.2−0.2 −0.2−0.2−0.3 −0.2 −0.2−0.5−0.4−0.4 −0.5−0.4 −0.4−0.4−0.5 −0.4−0.5
−0.1 −0.1−0.1−0.1 −0.1−0.1 −0.0 −0.0−0.0 −0.0−0.0−0.0 −0.0 −0.0−0.1−0.1−0.1 −0.1−0.2 −0.1−0.1−0.2 −0.1−0.2
−2.1 −2.1−2.1−2.4 −2.2−2.3 −1.9 −1.9−1.9 −1.9−2.0−2.2 −1.9 −1.9−2.1−2.2−2.3 −2.2−2.2 −2.1−2.1−2.3 −2.3−2.3
−2.2 −2.2−2.2−2.5 −2.2−2.4 −2.0 −2.0−2.0 −2.0−2.1−2.3 −2.0 −1.9−2.2−2.3−2.4 −2.3−2.4 −2.3−2.3−2.4 −2.3−2.4
−1.4 −1.4−1.4−1.4 −1.2−1.4 −1.3 −1.2−1.3 −1.3−1.3−1.3 −1.3 −1.2−1.2−1.3−1.3 −1.2−1.4 −1.4−1.4−1.3 −1.4−1.3
−1.7 −1.7−1.7−1.8 −1.5−1.8 −1.4 −1.4−1.5 −1.4−1.5−1.6 −1.4 −1.4−1.6−1.5−1.6 −1.6−1.6 −1.6−1.5−1.6 −1.6−1.5
−0.0 −0.00.00.0 −0.00.0 −0.0 0.0−0.0 −0.0−0.0−0.0 −0.0 0.0−0.0−0.00.0 0.0−0.0 −0.0−0.0−0.0 0.00.0
−1.9 −1.9−1.9−2.1 −2.0−1.9 −1.8 −1.7−1.7 −1.7−1.7−1.9 −1.7 −1.7−1.8−2.0−2.1 −1.8−2.1 −2.0−2.0−2.1 −2.0−2.0
−2.0 −2.0−2.0−2.1 −2.0−2.0 −1.8 −1.8−1.8 −1.8−1.8−2.0 −1.8 −1.8−1.8−2.1−2.1 −1.9−2.1 −2.1−2.1−2.1 −2.1−2.1
−1.7 −1.7−1.7−1.8 −1.7−1.8 −1.4 −1.3−1.4 −1.4−1.4−1.6 −1.5 −1.4−1.6−1.8−1.7 −1.6−1.8 −1.8−1.8−1.9 −1.8−1.7
−1.7 −1.8−1.7−1.9 −1.8−1.8 −1.3 −1.3−1.3 −1.3−1.3−1.7 −1.4 −1.4−1.6−1.8−1.8 −1.6−1.9 −1.9−1.9−1.9 −1.8−1.8
−1.9 −1.9−1.9−2.2 −2.0−2.0 −1.7 −1.6−1.7 −1.6−1.7−2.0 −1.7 −1.6−1.8−2.0−2.0 −1.9−2.0 −1.9−1.9−2.1 −2.0−2.1
−1.9 −1.9−1.9−2.1 −2.0−2.1 −1.8 −1.7−1.8 −1.7−1.8−2.0 −1.8 −1.7−1.9−2.0−2.1 −1.9−2.0 −1.9−1.9−2.1 −2.1−2.0
−2.0 −2.0−2.0−2.3 −2.1−2.2 −1.9 −1.8−1.9 −1.8−1.8−2.1 −1.9 −1.8−2.0−2.1−2.2 −2.1−2.2 −2.0−2.1−2.2 −2.2−2.2
−2.1 −2.0−2.0−2.3 −2.1−2.2 −2.0 −1.9−1.9 −1.9−2.0−2.2 −1.9 −1.8−2.1−2.2−2.3 −2.1−2.2 −2.1−2.1−2.3 −2.2−2.3
−2.0 −2.0−2.1−2.3 −2.1−2.2 −1.7 −1.7−1.7 −1.7−1.7−2.0 −1.7 −1.8−2.0−2.2−2.2 −2.0−2.1 −2.0−2.1−2.2 −2.2−2.2
−2.1 −2.0−2.1−2.1 −2.0−2.1 −2.1 −1.9−1.9 −1.8−2.0−2.1 −2.0 −1.9−2.0−2.1−2.0 −2.0−2.1 −2.1−2.1−2.0 −2.0−2.0
−2.3 −2.3−2.3−2.6 −2.4−2.5 −2.2 −2.1−2.2 −2.2−2.3−2.3 −2.2 −2.0−2.2−2.4−2.4 −2.3−2.4 −2.3−2.3−2.4 −2.3−2.4
−2.0 −2.0−2.0−2.2 −2.0−2.2 −1.7 −1.7−1.7 −1.6−1.7−2.0 −1.7 −1.7−1.9−2.1−2.1 −2.0−2.1 −2.0−2.0−2.1 −2.1−2.2
−2.4 −2.4−2.5−2.6 −2.4−2.5 −2.5 −2.3−2.3 −2.3−2.4−2.5 −2.3 −2.2−2.2−2.4−2.3 −2.2−2.3 −2.2−2.1−2.4 −2.3−2.3
−1.3 −1.4−1.4−1.6 −1.4−1.5 −1.2 −1.2−1.2 −1.2−1.2−1.5 −1.3 −1.3−1.5−1.5−1.5 −1.5−1.6 −1.4−1.5−1.7 −1.6−1.7
−0.7 −0.7−0.7−0.9 −0.8−0.8 −0.7 −0.8−0.7 −0.7−0.7−0.9 −0.7 −0.8−0.9−0.9−1.0 −1.0−0.7 −0.6−0.6−0.8 −0.7−0.8
−2.1 −2.0−2.1−2.4 −2.2−2.3 −2.0 −1.9−1.9 −1.9−2.0−2.2 −1.9 −1.9−2.0−2.2−2.2 −2.1−2.2 −2.1−2.1−2.2 −2.2−2.2
−1.8 −2.0−1.9−1.9 −1.9−2.0 −1.8 −1.7−1.8 −1.8−1.9−1.9 −1.8 −1.7−1.8−2.0−2.0 −1.9−1.9 −2.0−1.9−1.9 −1.9−1.9
−2.1 −2.2−2.1−2.2 −2.2−2.3 −2.0 −2.1−2.1 −2.1−2.2−2.1 −2.0 −1.9−2.0−2.2−2.2 −2.1−2.1 −2.2−2.2−2.1 −2.1−2.2
−1.6 −1.7−1.7−1.8 −1.7−1.8 −1.4 −1.4−1.4 −1.4−1.4−1.5 −1.4 −1.5−1.6−1.7−1.7 −1.7−1.7 −1.7−1.7−1.7 −1.7−1.8
−2.2 −2.2−2.3−2.5 −2.3−2.4 −2.2 −2.1−2.2 −2.1−2.2−2.3 −2.1 −2.0−2.2−2.3−2.4 −2.2−2.4 −2.3−2.3−2.4 −2.3−2.4
−1.8 −1.8−1.8−2.1 −1.9−2.0 −1.7 −1.6−1.7 −1.7−1.7−2.0 −1.7 −1.6−1.9−1.9−2.0 −1.9−2.0 −1.9−1.9−2.1 −2.0−2.1
−1.8 −1.8−1.8−2.2 −1.9−2.0 −1.8 −1.8−1.8 −1.8−1.8−2.1 −1.9 −1.9−2.0−2.0−2.1 −2.0−2.1 −1.9−2.0−2.2 −2.1−2.2
−2.2 −2.2−2.2−2.4 −2.2−2.3 −2.0 −1.9−1.9 −1.8−1.9−2.2 −2.0 −1.8−2.1−2.3−2.2 −2.1−2.3 −2.2−2.2−2.3 −2.3−2.3
−2.1 −2.1−2.1−2.4 −2.2−2.3 −2.1 −1.9−2.0 −2.0−2.1−2.2 −2.0 −1.9−2.1−2.2−2.3 −2.2−2.3 −2.2−2.2−2.3 −2.2−2.3
−2.3 −2.2−2.3−2.6 −2.4−2.5 −2.3 −2.3−2.3 −2.2−2.3−2.3 −2.2 −2.1−2.2−2.4−2.4 −2.3−2.3 −2.3−2.3−2.4 −2.3−2.4
−1.6 −1.6−1.6−1.9 −1.7−1.7 −1.5 −1.4−1.5 −1.4−1.5−1.7 −1.5 −1.5−1.7−1.7−1.8 −1.8−1.8 −1.6−1.7−1.9 −1.8−1.9
−1.8 −1.8−1.8−2.1 −1.9−2.0 −1.6 −1.5−1.6 −1.5−1.6−1.9 −1.6 −1.6−1.8−1.9−2.0 −1.9−1.9 −1.8−1.8−2.0 −1.9−2.0
−1.8 −1.8−1.8−2.2 −1.9−2.0 −1.8 −1.7−1.8 −1.7−1.8−2.0 −1.7 −1.6−1.9−2.0−2.0 −2.0−2.0 −1.9−1.9−2.1 −2.1−2.1
−2.0 −2.0−1.9−2.3 −2.0−2.1 −1.9 −1.8−1.8 −1.8−1.9−2.1 −1.8 −1.7−2.0−2.1−2.2 −2.1−2.0 −1.9−1.9−2.2 −2.1−2.1
−0.8 −0.9−0.8−1.1 −1.0−1.0 −0.8 −0.8−0.8 −0.7−0.7−1.0 −0.8 −0.8−1.1−1.1−1.0 −1.1−1.1 −1.1−1.1−1.1 −1.1−1.1
−0.9 −0.9−0.9−1.0 −0.9−1.1 −1.0 −0.9−0.9 −1.0−1.0−0.9 −0.9 −0.9−0.9−0.9−0.9 −0.9−0.9 −0.9−0.9−0.8 −0.8−0.9
−1.3 −1.4−1.4−1.6 −1.5−1.5 −0.9 −0.9−0.9 −1.0−1.0−1.4 −1.1 −1.3−1.4−1.5−1.6 −1.4−1.5 −1.4−1.4−1.6 −1.5−1.6
−1.6 −1.6−1.6−1.8 −1.7−1.7 −1.5 −1.4−1.4 −1.4−1.5−1.7 −1.5 −1.4−1.6−1.7−1.7 −1.6−1.7 −1.5−1.5−1.8 −1.6−1.7
−2.3 −2.3−2.3−2.6 −2.4−2.4 −2.3 −2.1−2.2 −2.2−2.3−2.3 −2.2 −2.0−2.2−2.4−2.5 −2.3−2.3 −2.2−2.2−2.4 −2.3−2.3
−2.3 −2.3−2.3−2.6 −2.4−2.4 −2.3 −2.1−2.1 −2.1−2.3−2.3 −2.2 −2.0−2.2−2.4−2.5 −2.3−2.4 −2.4−2.3−2.4 −2.3−2.4
−1.7 −1.7−1.7−2.0 −1.8−1.9 −1.7 −1.7−1.7 −1.6−1.7−1.9 −1.7 −1.6−1.8−1.9−2.0 −1.8−1.9 −1.8−1.8−2.0 −1.9−2.0
−2.0 −2.0−2.0−2.2 −2.1−2.1 −1.8 −1.9−1.8 −1.8−1.9−2.1 −1.9 −1.8−2.0−2.1−2.2 −2.0−2.1 −2.0−2.0−2.2 −2.0−2.1
−2.0 −2.0−2.0−2.2 −2.1−2.2 −2.0 −2.0−2.0 −1.9−2.0−2.2 −2.0 −1.8−2.0−2.1−2.1 −2.0−2.0 −2.0−2.0−2.2 −2.1−2.1
−1.5 −1.5−1.5−1.9 −1.6−1.8 −1.5 −1.3−1.4 −1.4−1.4−1.7 −1.5 −1.5−1.7−1.7−1.8 −1.7−1.8 −1.6−1.6−1.9 −1.8−1.9
−2.2 −2.2−2.3−2.6 −2.3−2.4 −2.1 −2.0−2.1 −2.1−2.1−2.3 −2.1 −1.8−2.2−2.3−2.5 −2.3−2.4 −2.3−2.3−2.4 −2.3−2.4
−2.0 −2.0−2.0−2.3 −2.1−2.1 −1.9 −1.9−1.9 −1.8−1.9−2.1 −1.9 −1.8−2.0−2.1−2.2 −2.1−2.2 −2.0−2.1−2.2 −2.2−2.2
−2.1 −2.1−2.2−2.4 −2.2−2.3 −1.9 −1.7−1.9 −1.9−1.9−2.3 −1.9 −1.9−2.1−2.3−2.2 −2.1−2.2 −2.2−2.2−2.3 −2.2−2.2
−1.3 −1.4−1.3−1.5 −1.4−1.4 −1.2 −1.2−1.2 −1.1−1.1−1.4 −1.2 −1.3−1.4−1.5−1.5 −1.4−1.6 −1.4−1.5−1.6 −1.6−1.6
−1.7 −1.7−1.7−1.9 −1.7−1.9 −1.8 −1.7−1.8 −1.7−1.8−1.9 −1.8 −1.7−1.7−1.8−1.8 −1.7−1.7 −1.7−1.6−1.8 −1.7−1.7
−2.0 −2.0−2.0−2.3 −2.1−2.2 −1.8 −1.8−1.8 −1.8−1.8−2.0 −1.8 −1.8−2.0−2.1−2.2 −2.1−2.2 −2.0−2.1−2.2 −2.2−2.2
0.0 −0.00.00.0 0.0−0.0 −0.1 −0.1−0.1 −0.0−0.0−0.0 −0.0 −0.0−0.00.00.0 −0.0−0.0 −0.00.0−0.0 0.00.0
−1.9 −1.9−2.0−2.0 −2.0−2.0 −1.7 −1.7−1.8 −1.7−1.7−2.0 −1.7 −1.6−1.8−1.9−2.0 −1.9−2.0 −2.0−2.0−2.0 −1.9−2.0
−0.2 −0.2−0.2−0.4 −0.3−0.3 −0.4 −0.3−0.4 −0.3−0.3−0.3 −0.4 −0.3−0.4−0.3−0.3 −0.4−0.5 −0.4−0.4−0.5 −0.5−0.5
−1.9 −1.8−1.9−2.0 −1.8−2.0 −1.8 −1.8−1.8 −1.7−1.8−1.9 −1.8 −1.7−1.8−1.8−1.8 −1.8−1.9 −1.8−1.8−1.9 −2.0−1.8
−0.5 −0.5−0.5−0.6 −0.5−0.5 −0.8 −0.7−0.7 −0.6−0.6−0.6 −0.7 −0.6−0.7−0.6−0.6 −0.6−1.0 −0.8−0.9−0.8 −0.7−0.9
−1.5 −1.6−1.5−1.8 −1.6−1.7 −1.4 −1.3−1.4 −1.3−1.3−1.6 −1.4 −1.3−1.6−1.6−1.7 −1.6−1.6 −1.4−1.5−1.7 −1.6−1.6
−1.4 −1.5−1.5−1.4 −1.4−1.3 −1.2 −1.1−1.1 −1.1−1.2−1.2 −1.2 −1.0−1.2−1.4−1.3 −1.2−1.7 −1.7−1.7−1.5 −1.6−1.4
−1.1 −1.3−1.2−1.1 −1.1−1.2 −1.0 −0.9−1.0 −0.9−1.0−1.2 −1.0 −1.2−1.1−1.2−1.2 −1.1−1.3 −1.2−1.3−1.3 −1.3−1.3
−1.3 −1.4−1.4−1.3 −1.3−1.3 −1.1 −1.1−1.1 −1.0−1.1−1.2 −1.2 −1.0−1.2−1.4−1.3 −1.2−1.6 −1.5−1.5−1.5 −1.5−1.4
−1.4 −1.5−1.5−1.4 −1.4−1.3 −1.2 −1.1−1.1 −1.1−1.2−1.2 −1.2 −1.0−1.2−1.4−1.3 −1.2−1.7 −1.6−1.6−1.5 −1.6−1.4
−1.8 −1.7−1.8−1.9 −1.8−1.8 −1.7 −1.6−1.7 −1.6−1.7−1.8 −1.7 −1.6−1.8−2.0−2.0 −1.9−1.9 −1.7−1.7−1.9 −1.8−1.9
−2.1 −2.1−2.1−2.4 −2.2−2.3 −2.1 −2.1−2.0 −2.0−2.1−2.2 −2.1 −1.9−2.1−2.2−2.3 −2.2−2.2 −2.1−2.2−2.3 −2.3−2.3
−1.9 −1.9−1.9−2.2 −2.0−2.0 −1.7 −1.6−1.6 −1.6−1.6−1.9 −1.7 −1.6−1.9−2.0−2.1 −2.0−2.0 −1.9−2.0−2.1 −2.0−2.1
−2.0 −2.0−2.0−2.3 −2.1−2.1 −1.8 −1.7−1.8 −1.7−1.7−2.0 −1.8 −1.7−2.0−2.1−2.2 −2.1−2.1 −2.0−2.1−2.1 −2.1−2.2
−0.8 −0.9−0.9−1.0 −1.0−0.9 −0.6 −0.6−0.6 −0.6−0.6−0.8 −0.7 −0.7−0.9−1.0−1.0 −0.9−1.0 −1.0−1.0−1.1 −1.0−1.0
−1.4 −1.5−1.5−1.4 −1.4−1.3 −1.1 −1.0−1.0 −0.9−1.1−1.2 −1.1 −0.9−1.2−1.4−1.2 −1.2−1.6 −1.5−1.6−1.5 −1.6−1.4
−0.1 −0.1−0.1−0.2 −0.1−0.1 −0.1 −0.1−0.1 −0.1−0.1−0.2 −0.2 −0.2−0.2−0.2−0.2 −0.2−0.4 −0.3−0.3−0.3 −0.3−0.4
−2.2 −2.2−2.2−2.5 −2.3−2.4 −2.1 −2.0−2.0 −2.1−2.1−2.4 −2.0 −2.0−2.2−2.3−2.3 −2.3−2.4 −2.3−2.3−2.3 −2.3−2.3
−2.3 −2.3−2.3−2.6 −2.4−2.5 −2.2 −2.1−2.1 −2.1−2.2−2.4 −2.1 −2.0−2.2−2.4−2.5 −2.3−2.4 −2.3−2.3−2.4 −2.3−2.4
−1.9 −1.9−1.9−2.1 −1.9−2.0 −1.7 −1.6−1.6 −1.6−1.6−1.9 −1.7 −1.7−1.8−1.9−1.9 −1.8−2.0 −1.9−1.9−2.1 −2.0−2.0
−2.1 −2.0−2.2−2.3 −2.1−2.2 −1.9 −1.7−1.9 −1.8−1.9−2.1 −1.9 −1.7−1.9−2.1−2.1 −1.9−2.2 −2.2−2.2−2.2 −2.2−2.2
−1.4 −1.4−1.4−1.8 −1.5−1.6 −1.4 −1.4−1.4 −1.3−1.3−1.6 −1.4 −1.4−1.6−1.5−1.6 −1.6−1.6 −1.4−1.5−1.7 −1.6−1.6
0.0 0.00.00.0 −0.0−0.0 0.0 0.00.0 −0.00.00.0 0.0 0.00.00.00.0 0.00.0 0.0−0.00.0 0.0−0.0
−1.9 −1.9−2.0−2.2 −2.0−2.1 −1.8 −1.7−1.7 −1.8−1.8−2.0 −1.8 −1.6−1.8−2.0−1.9 −1.8−2.1 −2.0−2.0−2.1 −2.0−2.0
−1.6 −1.6−1.6−1.8 −1.7−1.7 −1.5 −1.5−1.5 −1.4−1.5−1.6 −1.5 −1.3−1.5−1.7−1.7 −1.6−1.8 −1.8−1.7−1.8 −1.8−1.7
−1.6 −1.7−1.7−1.8 −1.7−1.8 −1.6 −1.5−1.6 −1.5−1.6−1.7 −1.6 −1.4−1.6−1.7−1.7 −1.6−1.9 −1.9−1.8−1.9 −1.9−1.8
−1.7 −1.8−1.8−2.0 −1.8−1.9 −1.5 −1.5−1.5 −1.5−1.5−1.9 −1.6 −1.6−1.8−1.9−1.9 −1.9−1.9 −1.7−1.7−1.9 −1.8−1.9
−1.7 −1.8−1.7−2.0 −1.8−1.9 −1.5 −1.5−1.5 −1.5−1.5−1.9 −1.6 −1.6−1.8−1.9−1.9 −1.9−1.9 −1.7−1.7−1.9 −1.8−1.9
−2.0 −2.0−2.0−2.3 −2.1−2.1 −1.9 −1.8−1.9 −1.8−1.8−2.0 −1.9 −1.8−2.0−2.1−2.2 −2.1−2.1 −2.0−2.1−2.1 −2.1−2.2
−2.0 −2.0−2.0−2.3 −2.1−2.1 −1.9 −1.8−1.9 −1.8−1.8−2.0 −1.9 −1.8−2.0−2.1−2.2 −2.0−2.1 −2.0−2.1−2.1 −2.1−2.2
−2.0 −2.0−2.1−2.1 −2.0−2.0 −1.7 −1.6−1.6 −1.5−1.6−1.7 −1.7 −1.4−1.6−1.9−1.8 −1.7−2.1 −2.1−2.1−2.1 −2.1−2.0
−0.1 −0.1−0.1−0.2 −0.2−0.2 −0.1 −0.1−0.1 −0.1−0.1−0.1 −0.1 −0.1−0.3−0.2−0.2 −0.2−0.4 −0.3−0.3−0.3 −0.3−0.4
−1.8 −1.8−1.9−2.0 −1.9−1.9 −1.6 −1.6−1.6 −1.5−1.6−1.8 −1.6 −1.6−1.8−1.9−2.0 −1.8−1.9 −1.8−1.8−2.0 −1.9−2.0
−1.9 −1.8−1.9−2.1 −1.9−2.0 −1.7 −1.6−1.7 −1.6−1.7−1.9 −1.7 −1.6−1.8−1.9−1.9 −1.8−2.0 −1.9−1.9−2.1 −2.0−2.0
−1.8 −1.8−1.8−1.7 −1.5−1.8 −1.9 −1.8−1.9 −1.9−1.9−1.8 −1.8 −1.7−1.5−1.6−1.6 −1.5−1.7 −1.8−1.7−1.6 −1.7−1.6
−1.7 −1.8−1.8−1.6 −1.5−1.8 −1.6 −1.6−1.7 −1.4−1.6−1.7 −1.6 −1.5−1.5−1.6−1.5 −1.5−1.6 −1.7−1.7−1.6 −1.7−1.5
−2.2 −2.1−2.2−2.4 −2.3−2.4 −2.1 −2.1−2.1 −2.1−2.2−2.4 −2.1 −1.9−2.2−2.3−2.5 −2.3−2.3 −2.2−2.2−2.3 −2.3−2.3
−0.0 −0.0−0.0−0.0 −0.0−0.0 0.0 −0.0−0.0 −0.0−0.0−0.0 −0.0 0.0−0.0−0.0−0.0 −0.0−0.0 −0.0−0.0−0.0 −0.0−0.0
−0.6 −0.7−0.6−0.8 −0.7−0.7 −0.4 −0.4−0.4 −0.4−0.4−0.6 −0.5 −0.6−0.8−0.8−0.8 −0.8−1.0 −0.8−0.9−0.9 −0.9−1.0
−2.1 −2.1−2.2−2.4 −2.2−2.4 −1.7 −1.7−1.8 −1.7−1.7−2.1 −1.8 −1.8−2.1−2.2−2.3 −2.2−2.3 −2.1−2.1−2.3 −2.2−2.3
−1.7 −1.8−1.7−1.6 −1.5−1.7 −1.8 −1.6−1.8 −1.5−1.7−1.7 −1.6 −1.5−1.5−1.6−1.5 −1.4−1.7 −1.8−1.7−1.6 −1.7−1.6
−1.8 −1.8−1.8−1.7 −1.5−1.8 −1.9 −1.8−1.9 −1.8−1.9−1.8 −1.7 −1.7−1.5−1.6−1.6 −1.5−1.7 −1.7−1.7−1.6 −1.7−1.5
−2.3 −2.2−2.2−2.4 −2.3−2.4 −2.0 −1.9−1.9 −1.9−2.0−2.3 −1.9 −2.0−2.2−2.3−2.4 −2.2−2.3 −2.2−2.2−2.3 −2.2−2.3
−0.6 −0.6−0.6−0.8 −0.7−0.7 −0.6 −0.6−0.6 −0.5−0.5−0.7 −0.6 −0.6−0.8−0.8−0.8 −0.8−0.8 −0.7−0.7−0.9 −0.8−0.9
−1.2 −1.3−1.3−1.6 −1.4−1.5 −1.1 −1.1−1.1 −1.0−1.1−1.4 −1.1 −1.3−1.4−1.5−1.6 −1.5−1.5 −1.3−1.3−1.6 −1.5−1.6
−2.0 −2.0−2.0−2.3 −2.1−2.2 −1.7 −1.6−1.7 −1.7−1.7−2.0 −1.7 −1.7−1.9−2.1−2.1 −2.1−2.1 −2.0−2.1−2.2 −2.1−2.1
−1.2 −1.3−1.3−1.3 −1.2−1.1 −0.7 −0.6−0.6 −0.6−0.7−0.8 −0.8 −0.8−1.1−1.3−1.2 −1.1−1.4 −1.4−1.4−1.5 −1.4−1.4
−1.9 −1.8−1.8−1.9 −1.9−1.9 −1.8 −1.8−1.8 −1.7−1.8−2.0 −1.8 −1.8−1.8−1.9−1.9 −1.9−2.0 −1.9−2.0−2.0 −2.0−2.0
−1.9 −1.9−1.9−2.2 −2.0−2.1 −1.7 −1.6−1.7 −1.6−1.7−2.0 −1.7 −1.7−1.9−2.0−2.1 −2.0−2.1 −1.9−2.0−2.2 −2.1−2.1
−1.7 −1.8−1.8−1.8 −1.6−1.9 −1.8 −1.7−1.8 −1.8−1.8−1.7 −1.7 −1.5−1.7−1.6−1.6 −1.7−1.9 −1.9−1.9−1.8 −1.8−1.8
−2.2 −2.2−2.2−2.3 −2.2−2.2 −2.1 −2.1−2.0 −2.0−2.1−2.2 −2.0 −1.9−2.1−2.3−2.2 −2.1−2.4 −2.3−2.3−2.2 −2.2−2.3
−2.1 −2.1−2.2−2.4 −2.2−2.3 −2.1 −1.9−2.0 −1.9−2.0−2.2 −2.0 −1.7−2.1−2.2−2.2 −2.1−2.3 −2.2−2.3−2.3 −2.3−2.3
−2.2 −2.2−2.3−2.4 −2.3−2.4 −1.9 −1.7−1.9 −1.8−2.0−2.2 −2.0 −1.7−2.1−2.3−2.3 −2.2−2.4 −2.3−2.4−2.3 −2.3−2.3
−1.2 −1.3−1.3−1.6 −1.3−1.5 −1.3 −1.3−1.4 −1.2−1.2−1.6 −1.3 −1.5−1.5−1.4−1.5 −1.5−1.6 −1.4−1.4−1.6 −1.6−1.6
−1.7 −1.7−1.7−1.9 −1.7−1.8 −1.7 −1.6−1.6 −1.6−1.6−1.8 −1.6 −1.6−1.7−1.7−1.7 −1.6−1.8 −1.7−1.7−1.8 −1.9−1.7
−2.0 −2.0−2.1−2.2 −2.1−2.2 −1.9 −1.7−1.9 −1.8−1.9−2.1 −1.9 −1.9−2.0−2.2−2.2 −2.1−2.1 −2.0−2.0−2.2 −2.0−2.2
−1.9 −1.9−1.9−2.0 −1.9−2.0 −1.7 −1.7−1.7 −1.7−1.7−1.9 −1.7 −1.6−1.8−1.9−2.0 −1.9−1.9 −1.8−1.7−1.9 −1.9−1.9
−0.8 −0.7−0.8−0.8 −0.8−0.7 −0.5 −0.5−0.5 −0.5−0.5−0.8 −0.6 −0.7−0.8−0.9−0.9 −0.8−0.8 −0.7−0.7−0.8 −0.7−0.8
−2.0 −2.0−2.0−2.3 −2.0−2.1 −1.9 −1.8−1.9 −1.8−1.9−2.0 −1.9 −1.7−2.0−2.1−2.1 −2.0−2.1 −2.0−2.1−2.2 −2.2−2.2
−2.2 −2.1−2.2−2.5 −2.2−2.3 −1.9 −1.9−1.9 −1.9−2.0−2.2 −1.9 −1.9−2.1−2.3−2.4 −2.2−2.2 −2.1−2.1−2.3 −2.2−2.3
−1.9 −1.8−1.9−2.1 −1.9−2.0 −1.8 −1.6−1.8 −1.7−1.8−2.0 −1.8 −1.8−1.9−2.0−2.0 −1.9−1.7 −1.6−1.6−1.9 −1.8−1.8
−1.6 −1.6−1.6−1.8 −1.7−1.7 −1.3 −1.3−1.3 −1.1−1.2−1.5 −1.4 −1.3−1.5−1.7−1.7 −1.6−1.7 −1.6−1.7−1.8 −1.8−1.7
−0.8 −0.9−0.8−1.0 −0.9−0.9 −0.9 −0.9−0.9 −0.9−0.9−1.2 −1.0 −1.1−1.2−0.9−0.8 −1.0−1.2 −1.1−1.1−1.3 −1.2−1.3
−0.9 −1.0−0.9−1.2 −1.1−1.1 −0.8 −0.8−0.8 −0.8−0.8−1.2 −0.9 −1.1−1.3−1.2−1.2 −1.3−1.1 −1.0−1.0−1.2 −1.1−1.2
−1.8 −1.8−1.8−2.1 −1.9−1.9 −1.7 −1.6−1.6 −1.6−1.6−1.9 −1.7 −1.6−1.8−1.9−2.0 −1.8−1.9 −1.8−1.8−2.0 −1.9−2.0
−0.1 −0.1−0.1−0.1 −0.1−0.1 −0.1 −0.1−0.1 −0.1−0.1−0.1 −0.1 −0.1−0.2−0.1−0.1 −0.2−0.4 −0.3−0.4−0.2 −0.3−0.3
−1.5 −1.6−1.5−1.8 −1.6−1.7 −1.4 −1.3−1.3 −1.3−1.3−1.6 −1.4 −1.4−1.7−1.7−1.8 −1.7−1.9 −1.7−1.7−1.9 −1.8−1.9
−1.7 −1.7−1.7−1.9 −1.8−1.8 −1.5 −1.4−1.5 −1.4−1.4−1.7 −1.5 −1.6−1.8−1.8−1.9 −1.8−1.9 −1.8−1.8−2.0 −2.0−2.0
−1.2 −1.4−1.4−1.5 −1.4−1.2 −0.7 −0.7−0.7 −0.6−0.7−1.0 −0.8 −0.9−1.2−1.4−1.3 −1.3−1.6 −1.5−1.5−1.6 −1.6−1.6
−1.7 −1.7−1.7−2.0 −1.8−1.9 −1.6 −1.5−1.6 −1.5−1.5−1.8 −1.6 −1.5−1.8−1.8−1.9 −1.8−1.9 −1.7−1.7−2.0 −1.9−1.9
−1.9 −1.9−2.0−2.2 −2.0−2.1 −1.7 −1.6−1.8 −1.7−1.7−2.0 −1.8 −1.7−2.0−2.0−2.1 −2.0−2.1 −2.0−2.0−2.2 −2.1−2.1
−2.4 −2.3−2.4−2.7 −2.5−2.5 −2.3 −2.2−2.3 −2.3−2.3−2.5 −2.2 −2.3−2.3−2.5−2.6 −2.4−2.5 −2.4−2.4−2.5 −2.5−2.5
−2.4 −2.4−2.4−2.8 −2.5−2.5 −2.3 −2.2−2.3 −2.3−2.4−2.5 −2.2 −2.2−2.3−2.5−2.7 −2.4−2.5 −2.5−2.5−2.5 −2.5−2.5
−1.6 −1.6−1.6−1.3 −1.3−1.3 −1.6 −1.4−1.3 −1.4−1.5−1.3 −1.5 −0.9−1.2−1.3−1.2 −1.2−1.7 −1.7−1.7−1.4 −1.5−1.3
−1.5 −1.6−1.5−1.2 −1.2−1.2 −1.6 −1.4−1.3 −1.3−1.5−1.3 −1.4 −0.9−1.2−1.2−1.1 −1.2−1.7 −1.7−1.7−1.3 −1.4−1.3
−1.9 −1.9−1.9−2.1 −1.9−2.0 −1.7 −1.8−1.8 −1.7−1.8−1.9 −1.8 −1.7−1.8−2.0−2.0 −1.8−2.0 −1.9−1.9−2.0 −2.1−2.0
−2.3 −2.2−2.4−2.6 −2.3−2.5 −2.2 −2.0−2.0 −2.0−2.1−2.3 −2.1 −1.8−2.2−2.4−2.4 −2.2−2.3 −2.2−2.2−2.4 −2.3−2.3
−1.3 −1.8−1.5−1.3 −1.4−1.2 −1.3 −1.2−1.2 −1.2−1.3−1.4 −1.4 −1.1−1.3−1.5−1.5 −1.3−1.8 −1.5−1.6−1.6 −1.5−1.6
−0.8 −0.9−0.9−1.1 −1.0−1.0 −1.0 −0.9−0.9 −0.8−0.9−1.1 −1.0 −1.0−1.1−1.1−1.1 −1.1−1.4 −1.1−1.3−1.3 −1.3−1.4
−2.3 −2.3−2.3−2.6 −2.4−2.5 −2.1 −2.0−2.1 −2.0−2.2−2.2 −2.1 −2.0−2.1−2.4−2.3 −2.2−2.4 −2.3−2.3−2.4 −2.3−2.4
visionlabs_007
visionlabs_006
didiglobalface_001
hr_002
deepglint_001
imperial_002
alphaface_001
ntechlab_007
imperial_000
facesoft_000
yitu_003
innovatrics_006
winsense_001
anke_004
ntechlab_006
sertis_000
camvi_004
tech5_003
mt_000
sjtu_001
hr_001
anke_003
tevian_004
everai_paravision_003
uluface_002
hik_001
tevian_005
camvi_002
intellifusion_001
einetworks_000
cyberlink_003
aiunionface_000
incode_005
intellicloudai_001
dahua_003
asusaics_000
shu_001
cyberlink_002
tongyi_005
pixelall_003
ulsee_001
remarkai_000
remarkai_001
incode_004
intsysmsu_000
idemia_005
neurotechnology_006
dahua_002
cogent_004
gorilla_004
starhybrid_001
visionbox_001
deepsea_001
ctbcbank_001
pyramid_000
synology_000
idemia_004
winsense_000
cogent_003
synesis_005
everai_002
iqface_000
gorilla_003
neurotechnology_005
ctbcbank_000
itmo_006
alchera_000
pixelall_002
trueface_000
samtech_001
upc_001
3divi_004
via_000
rokid_000
incode_003
alchera_001
id3_004
meiya_001
saffe_002
intelresearch_000
visionbox_000
tech5_002
realnetworks_003
realnetworks_002
sensetime_001
tiger_003
siat_004
vigilantsolutions_007
rankone_007
id3_003
siat_002
sensetime_002
rankone_006
cognitec_000
cognitec_001
innovatrics_004
f8_001
imagus_001
vigilantsolutions_006
ceiec_002
vd_001
kakao_002
psl_002
3divi_003
tiger_002
digitalbarriers_002
x−laboratory_000
vocord_006
intellivision_002
vocord_007
smilart_003
kedacom_000
lookman_004
ceiec_001
aware_004
imagus_000
lookman_002
nodeflux_002
kneron_003
aware_003
vion_000
adera_001
yisheng_004
veridas_002
synesis_004
veridas_001
iit_001
iit_000
awiros_001
nodeflux_001
dsk_000
tuputech_000
smilart_002
kakao_001
shaman_001
isap_001
ayonix_000
amplifiedgroup_001
saffe_001
notiontag_000
videonetics_001
bm_001
intsysmsu_001
shaman_000
chtface_001
psl_003
2_El_Salvador
2_Nicaragua
7_Phillippines
7_Vietnam
6_Iraq
7_China
6_Iran
7_Thailand
2_Mexico
5_Ethiopia
7_Korea
7_Japan
6_Pakistan
1_Ukraine
1_Poland
1_Russia
6_India
4_Jamaica
3_Ghana
5_Kenya
3_Nigeria
4_Haiti
3_Liberia
5_Somalia
Country of birth
Algorithm
−3
−2
−1
0
Dataset:
Application
vs.
Border
Crossing
FMR = 1e−05
log10 FNMR
reports/11/figures/dhs_obim/entry_to_visa/fnmr_by_sex_age_country_all_algorithms_heatamp.pdf
Figure 22: For 24 countries in seven regions the figure shows verification false non-match rates when the reference algo-
rithm is used to compare two photos of subjects from the countries identified in the respective columns. The FNMR value
is the mean over men/women and over/under age 45, so represents FNMR in situations where those four populations
were balanced. The threshold is set to a fixed value everywhere; is is the lowest value that gives FMR ≤ 0.00001. Each cell
depicts FNMR on a logarithmic scale. The text value is log
10
(FNMR) with large negative values encoding superior false
match rates.
Links:
EXEC. SUMMARY
TECH. SUMMARY
False positive: Incorrect association of two subjects 1:1 FMR 1:N FPIR
False negative: Failed association of one subject 1:1 FNMR 1:N FNIR
T 0 → FMR, FPIR → 0
→ FNMR, FNIR → 1

This publication is available free of charge from: https://doi.org/10.6028/NIST.IR.8280
2019/12/19 08:14:00 FRVT - FACE RECOGNITION VENDOR TEST - DEMOGRAPHICS 61
6 False negative differentials in identification
The three identification trials all use just mugshot photographs. They were conceived of to isolate specific
demographic factors as follows.
Sex: We construct a gallery containing 800 000 white men, and 800 000 white women, aged 20 - 40. We
search that with mated probes taken in a different calendar year to the enrolled photo but no longer than
5 years after. We search with balanced sets of non-mate probes, also aged 20-40.
Sex: We construct a gallery containing 500 000 black men, and 500 000 black women, aged 20 - 40. We
search that with mated probes taken in a different calendar year to the enrolled photo but no longer than
5 years after. We search with balanced sets of non-mate probes, also aged 20-40.
Race: We construct a gallery containing 800 000 black men, and 800 000 white men, aged 20 - 40. We
search that with mated probes taken in a different calendar year to the enrolled photo but no longer than
5 years after. We search with balanced sets of non-mate probes, also aged 20-40.
More detail appears in Annex 16 . In each case the mated probes are used to measure false negative identifica-
tion rate, and the nonmated probes are used to measure false positive identification rate. These tests all employ
domestic mugshots, and only younger adults. Further work will extend analysis to a global population with
more range in age.
6.1 Metrics
The metrics appropriate to identification have been detailed in section 3.2. These are related to particular
applications in Figure 23 reflecting two modes of operation. The general metric FNIR(N, R, T ) covers both as
follows:
Investigation: For investigators willing to traverse long candidate lists in pursuit of a lead, the metric
FNIR(N, R, 0) is the proportion of missed mates when searching an N-enrollee gallery and considering
the R most similar candidates without applying a threshold (T = 0). The utility of longer lists is shown
by plotting FNIR vs. R.
Identification: For those applications where a non-zero threshold is used to only return results when a
search has a likely enrolled mate, the metric is FNMR(N, R, T ). The use of thresholds T > 0 will suppress
many false positives, but will also elevate false negatives, the tradeoff being shown as a plot of FNIR(T)
vs. FPIR(T).
Links:
EXEC. SUMMARY
TECH. SUMMARY
False positive: Incorrect association of two subjects 1:1 FMR 1:N FPIR
False negative: Failed association of one subject 1:1 FNMR 1:N FNIR
T 0 → FMR, FPIR → 0
→ FNMR, FNIR → 1

This publication is available free of charge from: https://doi.org/10.6028/NIST.IR.8280
2019/12/19 08:14:00 FRVT - FACE RECOGNITION VENDOR TEST - DEMOGRAPHICS 62
Detection and
localization
Feature extraction
e.g. CNN model
Search Algorithm
e.g. N comparisons
Automated
face
recognition
engine
evaluated as
black box.
This grey box
is the scope of
NIST’s
evaluation.
Alice
Bob
Ben
Eve
Dawn
Sam
Alex
Eva
Pat
Jack
Jill
Bill
Zeke
Zack
Search Photo
The enrollment
database
consists of
images and
any biographic
data.
The algorithm
is given the
images and
and a pointer
to the record
Enrolled database:
Array, tree, index or
other data structure
Feature extraction
e.g. CNN model
ID
Rank
Score
Pat
1
3.142
Bob
2
2.998
Ben
3
1.602
Zeke
4
0.707
...
Output is a candidate list. Its length is determined by preset configuration of
rank and threshold, and these are set to implement objectives.
Positive identification
Negative identification
Post
-event investigation
Example
Access to a gym or cruise ship
Watchlist e.g. Detection of deportee or
duplicate drivers license applications
Crime scene photos, or of detainee
without ID documents.
Claim of identity
Implicit claim to be enrolled
Implicit claim to not be enrolled
No claim: Inquiry
Threshold
High, to implement security
objective
High, to limit false positives
Zero
Num. candidates
1
0
L, set by request to algorithm
Human role
Review candidate to assist user in
resolution of false negatives, or to
detect impostor
Review candidate to determine false
positive or correct hit
Review multiple candidates, refer
possible hits to examiners see [26]
Intended human
involvement
frequency
Rare
– approx. the false negative
identification rate plus prior
probability of impostor
Rare
– approx. the false positive
identification rate plus prior probability
of an actual mate
Always
Performance
metric of interest
FNIR at low FPIR. See sec. 3.1, 3.2
and Tables 10, 19
FNIR at low FPIR. See sec. 3.1, 3.2 and
Tables 10, 19
FNIR at ranks 1... 50, say. FPIR = 1.
See sec. 3.2 and Table 12, 14, 16
ID
Rank
Score
Usually correct response is
empty list as most searches are
non-
mated
ID
Rank
Score
Pat
1
3.142
Usually the correct response is
for one entry as most searches
will be mated
Figure 23: Identification applications and relevant metrics.
Links:
EXEC. SUMMARY
TECH. SUMMARY
False positive: Incorrect association of two subjects 1:1 FMR 1:N FPIR
False negative: Failed association of one subject 1:1 FNMR 1:N FNIR
T 0 → FMR, FPIR → 0
→ FNMR, FNIR → 1

This publication is available free of charge from: https://doi.org/10.6028/NIST.IR.8280
2019/12/19 08:14:00 FRVT - FACE RECOGNITION VENDOR TEST - DEMOGRAPHICS 63
6.2 Results
Figures 24 and 25 show identification error rates for two algorithms. Plots for all algorithms are included in
Annex 16 . In each case, the upper panels show FNIR vs R. The lower panels show FNIR vs. FPIR. We make
the following observations
Differentials by race in men: From the left-side panels, black men invariably give lower false negative
identification rates than white men. This applies in the investigate and identification modes, and par-
ticularly for the more accurate algorithms. The differentials are often small, well below a factor of two.
The are some exceptions including algorithms from 3DiVi, Aware, Eyedea, Idemia, Kedacom, Tevian and
Vocord.
Differentials between the sexes: Women invariably give higher false negative rates than men. This applies
within both racial groups. There are exceptions, notably that searches of white women are more likely
to produce the correct result in the top ranks than are search of men. This is less true for black women.
A possible mechanism for this is available from section 4 verification results, namely that black women
tend to produce high one-to-one false match rates. High non-mate scores may be displacing the correct
black women from rank 1 position.
Low FPIR is not attainable: The error tradeoff characteristics show a rapid increase FNIR as the threshold
is increased to reduce FPIR. For example, in FNIR Figure 24, FNIR reaches 50% when FPIR is reduced to
0.0001. This is due to the presence of high scoring non-mates in the imposter searches. They can occur
for several reasons. First, ground truth identity labeling errors in which photos of a person are in the
database under multiple IDs. These cause apparent false positives. We discount this because the mugshot
ground truth integrity is excellent, and underpinned by ten-print fingerprint matching. A second reason
is the presence of twins in the population. Given the population represented by the dataset, we estimate
a few percent of the United States adult population is present in the dataset. Given well documented
twinning rates
14
[27], we expect twins to be in the data, both identical and, more commonly, fraternal.
Siblings will be expected to give elevated similarities along the same lines.
Higher false positive identification rates in black women: The lines connecting points of fixed threshold
are often long and slanted in the error tradeoff plots in the center column of the bottom row - see Figure
24, for example. This is a common occurence revealing an order-of-magnitude increase in FPIR, with
magnitudes varying by algorithm. Notably some algorithms do not exhibit this excursion. For example,
the algorithm featured in Figure 25 gives much smaller excursions in FPIR.
14
See the CDC’s National Vital Statistics Report for 2017: https://www.cdc.gov/nchs/data/nvsr/nvsr67/nvsr67 08-508.pdf
Links:
EXEC. SUMMARY
TECH. SUMMARY
False positive: Incorrect association of two subjects 1:1 FMR 1:N FPIR
False negative: Failed association of one subject 1:1 FNMR 1:N FNIR
T 0 → FMR, FPIR → 0
→ FNMR, FNIR → 1

This publication is available free of charge from: https://doi.org/10.6028/NIST.IR.8280
2019/12/19 08:14:00 FRVT - FACE RECOGNITION VENDOR TEST - DEMOGRAPHICS 64
reports/1N/figures/fbi/ngi/race_sex/cmcs_dets/imperial_000.pdf
BW_male_20_40_balanced
MF_black_20_40_balanced
MF_white_20_40_balanced
1 3 10 30 50 1 3 10 30 50 1 3 10 30 50
0.002
0.003
0.005
Rank
False negative identification rate (FNIR)
race
Black
White
Dataset:
MUGSHOTS
Female
Male
BW_male_20_40_balanced
MF_black_20_40_balanced
MF_white_20_40_balanced
1e−04
3e−04
1e−03
3e−03
1e−02
3e−02
1e−01
3e−01
1e+00
1e−04
3e−04
1e−03
3e−03
1e−02
3e−02
1e−01
3e−01
1e+00
1e−04
3e−04
1e−03
3e−03
1e−02
3e−02
1e−01
3e−01
1e+00
0.001
0.002
0.003
0.005
0.007
0.010
0.020
0.030
0.050
0.070
0.100
0.200
0.300
0.500
0.700
False positive identification rate, FPIR(T)
False negative identification rate, FNIR(T)
race
Black
White
Thresholds
1.743
1.588
1.531
1.454
set for white
males for FPIR
0.0003
0.0030
0.0300
0.3000
Female
Male
Figure 24: For mugshot identification, the top row shows false negative identification “miss” rates as a function of rank,
a metric appropriate to investigators traversing candidate lists for lead generation. The bottom row shows miss rates as
a function of false positive identification rate, where a threshold is swept from a low value on the right to high values
on the left. This metric is appropriate to organizations for which the volume of searches is high enough that they cannot
afford labor to review results from every search. The left panels show the effect of race in young men. The center and
right panels show difference between men and women, in black then white subjects respectively. The grey lines join points
of equal threshold. The four thresholds are chosen to give FPIR of {0.0003, 0.003, 0.03, 0.3} respectively for one baseline
demographic, here white males. The figure applies to one algorithm, provided to NIST in August 2019. The corresponding
figures for all identification algorithms appear in Annex 16 .
Links:
EXEC. SUMMARY
TECH. SUMMARY
False positive: Incorrect association of two subjects 1:1 FMR 1:N FPIR
False negative: Failed association of one subject 1:1 FNMR 1:N FNIR
T 0 → FMR, FPIR → 0
→ FNMR, FNIR → 1

This publication is available free of charge from: https://doi.org/10.6028/NIST.IR.8280
2019/12/19 08:14:00 FRVT - FACE RECOGNITION VENDOR TEST - DEMOGRAPHICS 65
reports/1N/figures/fbi/ngi/race_sex/cmcs_dets/idemia_4.pdf
BW_male_20_40_balanced
MF_black_20_40_balanced
MF_white_20_40_balanced
1 3 10 30 50 1 3 10 30 50 1 3 10 30 50
0.005
0.007
0.010
0.020
Rank
False negative identification rate (FNIR)
race
Black
White
Dataset:
MUGSHOTS
Female
Male
BW_male_20_40_balanced
MF_black_20_40_balanced
MF_white_20_40_balanced
1e−04
3e−04
1e−03
3e−03
1e−02
3e−02
1e−01
3e−01
1e+00
1e−04
3e−04
1e−03
3e−03
1e−02
3e−02
1e−01
3e−01
1e+00
1e−04
3e−04
1e−03
3e−03
1e−02
3e−02
1e−01
3e−01
1e+00
0.005
0.007
0.010
0.020
0.030
0.050
0.070
0.100
0.200
0.300
0.500
0.700
False positive identification rate, FPIR(T)
False negative identification rate, FNIR(T)
race
Black
White
Thresholds
2179.743
1637.344
1337.657
1011.930
set for white
males for FPIR
0.0003
0.0030
0.0300
0.3000
Female
Male
Figure 25: For mugshot identification, the top row shows false negative identification “miss” rates as a function of rank,
a metric appropriate to investigators traversing candidate lists for lead generation. The bottom row shows miss rates as
a function of false positive identification rate, where a threshold is swept from a low value on the right to high values
on the left. This metric is appropriate to organizations for which the volume of searches is high enough that they cannot
afford labor to review results from every search. The left panels show the effect of race in young men. The center and
right panels show difference between men and women, in black then white subjects respectively. The grey lines join points
of equal threshold. The four thresholds are chosen to give FPIR of {0.0003, 0.003, 0.03, 0.3} respectively for one baseline
demographic, here white males. The figure applies to one algorithm, provided to NIST in June 2018. The corresponding
figures for all identification algorithms appear in Annex 16 .
Links:
EXEC. SUMMARY
TECH. SUMMARY
False positive: Incorrect association of two subjects 1:1 FMR 1:N FPIR
False negative: Failed association of one subject 1:1 FNMR 1:N FNIR
T 0 → FMR, FPIR → 0
→ FNMR, FNIR → 1

This publication is available free of charge from: https://doi.org/10.6028/NIST.IR.8280
2019/12/19 08:14:00 FRVT - FACE RECOGNITION VENDOR TEST - DEMOGRAPHICS 66
7 False positive differentials in identification
The section addresses whether identification algorithms exhibit similar false positive differentials to verifi-
cation algorithms. We first note that large-scale one-to-many identification deployments typically operate at
false match rates much lower than those targeted in verification applications. It is typical in verification access
control to target false match rates (FMR) between 0.00001 and 0.001, i.e. between one per hundred thousand
and one per thousand. Identification applications, howveer, often enroll very large numbers of individuals
numbering into the 10s or 100s of millions. If such systems are configured with thresholds aimed at producing
false positive outcomes say one in 100 times, i.e. FPIR = 0.01, then the implied likelihood that a comparison
will yield a false match is given by this formula
FMR =
F P IR
N
(10)
where N is the size of the enrolled population. With FPIR= 0.01, and N= 10
6
s this formula implies FMR=
10
−8
. The formula gives a first order equivalence of identification with verification: the former needs low false
positive rates in large galleries. Metrics are discussed in section 3.
Some one-to-many search algorithms implement a 1:N search of a probe image as N 1:1 comparisons of the
probe with the N enrolled items. This is followed by a sort operation which yields N candidates sorted in
decreasing order of similarity. The result of that is returned in either of two ways: The system will return an
operator-specified number of candidates, or it will return however many candidates are above an operator-
specified threshold
15
. In the case where a threshold is used, the number of candidates returned will be a
random-variable that is dependent on the image data itself.
Other algorithms do not implement 1:N search as N 1:1 comparisons. Instead they might employ a set of fast-
search algorithms aimed at expediting search [2, 19, 21, 26]. These include various techniques to partition the
enrollment data so that far fewer than N comparisons are actually executed. However, this does not mean that
false positive occurences will be reduced because the algorithms are still tasked with finding the most similar
enrollments.
For the three experiments listed in section 6, Figure 26 shows median scores returned by one identification
algorithm when non-mated searches are conducted. It is clear that if a threshold is applied there will be
demographic differences in the number of candidates returned, and in the score values. Such behavior applies
to many algorithms - see Annex 17 .
This effect disappears in the algorithm featured in Figure 27. This is an important result because it implies
much more equitable likelihoods of false positives. This is especially important result in negative identification
15
The “operator-specified” parameters might sometimes be set by-policy, or by the manufacturer of the system.
Links:
EXEC. SUMMARY
TECH. SUMMARY
False positive: Incorrect association of two subjects 1:1 FMR 1:N FPIR
False negative: Failed association of one subject 1:1 FNMR 1:N FNIR
T 0 → FMR, FPIR → 0
→ FNMR, FNIR → 1

This publication is available free of charge from: https://doi.org/10.6028/NIST.IR.8280
2019/12/19 08:14:00 FRVT - FACE RECOGNITION VENDOR TEST - DEMOGRAPHICS 67
reports/1N/figures/fbi/ngi/natural/score_heatmaps_by_rank_and_demographics/ntechlab_6.pdf
N = 12000000
N = 1600000
lifetime_consolidated
recent
Asian
Female
Asian
Male
Black
Female
Black
Male
White
Female
White
Male
Asian
Female
Asian
Male
Black
Female
Black
Male
White
Female
White
Male
0
10
20
30
40
50
0
10
20
30
40
50
Rank
0.700
0.725
0.750
Dataset
MUGSHOT
Algorithm
ntechlab_6
NONMATE
N = 12000000
N = 1600000
lifetime_consolidated
recent
Asian
Female
Asian
Male
Black
Female
Black
Male
White
Female
White
Male
Asian
Female
Asian
Male
Black
Female
Black
Male
White
Female
White
Male
0
10
20
30
40
50
0
10
20
30
40
50
Demographics of search subject
Rank
0.70
0.75
0.80
0.85
0.90
MATE
Figure 26: For searches of Asian, black, white men and women’s faces into mixed galleries of mugshot photos the heatmaps
show median similarity scores for candidates placed at rank 1 to 50. The upper four panels are produced in nonmated
searches; the lower four from mated searches. The left-side panels are produced from searches into galleries with 12 000 000
people enrolled. The right-side uses galleries with N = 1 600 000 enrolled. The “lifetime consolidated” and “recent” labels
refer to inclusion of multiple images per person, or just one - see [17].
Contrast the behavior here with that in Figure 27 and the corresponding figures for developers Aware, Idemia, NEC,
Tevian, and Toshiba that are included in Annex 17 .
applications where the prior probability of a searched person actually being is in the database is low, e.g. card-
sharp surveillance in a casino, or soccer hooligans at a sports game
16
. The lack of an effect on false positive
identification rates is evident in Figure 25 where the grey lines join points of equal threshold. From left-to-
right, the FPIR values for black and white males, black men and women, and white men and women are
closely similar. The more normal behavior (see Figure 24 and Annex 16 ) is for larger shifts in false positive
rates.
We now consider the implications for investigative “lead generation” applications. In such cases, algorithms
return a fixed number of candidates and human reviewers compare the probe photo alongside each candidate
gallery photo to determine if the photos are a match. In mugshot-mugshot searches the reviewer will very
often look no further than rank 1 per the very high accuracy results documented in NIST Interagency Report
16
For example, a recent news article noted the use of automated face recognition to search around 21 000 spectators at soccer games against
a watch-list of about 50 people.
Links:
EXEC. SUMMARY
TECH. SUMMARY
False positive: Incorrect association of two subjects 1:1 FMR 1:N FPIR
False negative: Failed association of one subject 1:1 FNMR 1:N FNIR
T 0 → FMR, FPIR → 0
→ FNMR, FNIR → 1

This publication is available free of charge from: https://doi.org/10.6028/NIST.IR.8280
2019/12/19 08:14:00 FRVT - FACE RECOGNITION VENDOR TEST - DEMOGRAPHICS 68
reports/1N/figures/fbi/ngi/natural/score_heatmaps_by_rank_and_demographics/idemia_5.pdf
N = 12000000
N = 1600000
lifetime_consolidated
recent
Asian
Female
Asian
Male
Black
Female
Black
Male
White
Female
White
Male
Asian
Female
Asian
Male
Black
Female
Black
Male
White
Female
White
Male
0
10
20
30
40
50
0
10
20
30
40
50
Rank
0
200
400
600
800
Dataset
MUGSHOT
Algorithm
idemia_5
NONMATE
N = 12000000
N = 1600000
lifetime_consolidated
recent
Asian
Female
Asian
Male
Black
Female
Black
Male
White
Female
White
Male
Asian
Female
Asian
Male
Black
Female
Black
Male
White
Female
White
Male
0
10
20
30
40
50
0
10
20
30
40
50
Demographics of search subject
Rank
0
1000
2000
3000
4000
5000
MATE
Figure 27: For searches of Asian, black, white men and women’s faces into mixed galleries of mugshot photos the heatmaps
show median similarity scores for candidates placed at rank 1 to 50. The upper four panels are produced in nonmated
searches; the lower four from mated searches. The left-side panels are produced from searches into galleries with 12 000 000
people enrolled. The right-side uses galleries with N = 1 600 000 enrolled. The “lifetime consolidated” and “recent” labels
refer to inclusion of multiple images per person, or just one - see [17]. The uniformity of the scores across demographic
groups is in contrast to that evident in Figure 26 and many others in the Annex 17 compendium.
Links:
EXEC. SUMMARY
TECH. SUMMARY
False positive: Incorrect association of two subjects 1:1 FMR 1:N FPIR
False negative: Failed association of one subject 1:1 FNMR 1:N FNIR
T 0 → FMR, FPIR → 0
→ FNMR, FNIR → 1

This publication is available free of charge from: https://doi.org/10.6028/NIST.IR.8280
2019/12/19 08:14:00 FRVT - FACE RECOGNITION VENDOR TEST - DEMOGRAPHICS 69
8271. That report also includes a workload measure summarizing the expected number of candidates that will
have to be reviewed before a mate is located. A very important parameter in such applications, however, is
the prior probability that a mate is actually present. In boarding a cruise ship for example, almost everyone
attempting to board would be present in the gallery. In a casino application aimed at detecting “high rollers”
the likelihood a patron of the casino is in that set is much lower. In such cases a human reviewer, if so employed,
would in most searches review all say 50 candidates on the list. That’s laborious and may not be tenable from
an operations research perspective due to fatigue and reward factors in humans.
But in whatever circumstances human reviewers are tasked with reviewing candidate lists, how are demo-
graphic differentials such as those in Figure 26 expected to influence the human? The human will see fifty
candidates regardless. However, if those candidates are accompanied by scores, presented as text in a GUI for
example, the reviewer will see higher scores in the black female population and potentially elsewhere. Over
time this may influence the human, though one earlier study [12] looked at cognitive bias issues in the hu-
man review of fingerprint search results, without demographic effects, and found scant evidence that scores
influence the reviewer. That study did, however, find that just the order in which candidates are presented to
reviewers affects both false positives and false negatives. For example, reviewers are more likely to miss (i.e.
a false negative) a mated candidate that appears far down the candidate list. The issues involved in human
review are beyond the scope of this document, but full consideration of systems comprised of automated face
search algorithms and human reviewers is an experimental psychology, human factors and operations research
issue.
Links:
EXEC. SUMMARY
TECH. SUMMARY
False positive: Incorrect association of two subjects 1:1 FMR 1:N FPIR
False negative: Failed association of one subject 1:1 FNMR 1:N FNIR
T 0 → FMR, FPIR → 0
→ FNMR, FNIR → 1

This publication is available free of charge from: https://doi.org/10.6028/NIST.IR.8280
2019/12/19 08:14:00 FRVT - FACE RECOGNITION VENDOR TEST - DEMOGRAPHICS 70
8 Research toward mitigation of false negatives
False negative error rates, and demographic differentials therein, are reduced in standards-compliant images.
This motivates the following two research and development possibilities.
Improved standards compliance: The ISO/IEC 19794-5 standard includes requirements regulating geom-
etry and exposure. Recent research [24] noted that higher quality images, as determined by an automated
quality assessment algorithm, yields a reduced false negative differential. While commercial packages exist
for the automated assessment of quality, and NIST has an ongoing assessment of the underlying algorithms,
rejection of single images on quality grounds can itself have demographic problems [1]. The ISO/IEC SC 37
biometrics subcommittee has recently initiated work on quality (ISO/IEC 29794-5 and 24357).
Face-aware cameras: The same ISO/IEC committee has recently initiated work on specifications for cap-
ture subsystems that may require real-time face detection, pose estimation, and exposure measurement.
Analogous “auto-capture” quality control mechanisms exist in iris and fingerprint scanners. That standard,
ISO/IEC 24358, will be developed through 2020 with completion expected in 2021. Participation is open via
national standardization groups.
Along similar lines further research into automated image quality assessment, and particularly specifications
for closed-loop face-aware capture would prove valuable in averting low-contrast and over- and under-
exposed images. Many enrollment operations still rely on documentary photography standards with cam-
eras that are not detecting and metering off faces.
This work would be supported by research into two further topics:
Analysis: There is a need for improved models of demographic effects, particularly to how subject-specific
properties including phenotypes, imaging artefacts and algorithms interact. Such models would extend work
[9] in separating the relative contributions of at least, sex, age, race and height. Efforts to automatically esti-
mate phenotypic information from images will involve algorithms that may themselves exhibit demographic
differentials. Such work will need to address this possibility.
Information theoretic analysis: Given the potential for poorly illuminated photographs to produce false neg-
atives, via under- or over-exposure of dark or light skin, an information theoretic approach to characterize
algorithmic response to poor lighting would be useful for future standardization. In particular, the ISO/IEC
19794-5 standard has, since 2004, required portrait photos to have at least 7 bits of content in each color channel.
Such work should quantify both false negative and false positive dependence.
Links:
EXEC. SUMMARY
TECH. SUMMARY
False positive: Incorrect association of two subjects 1:1 FMR 1:N FPIR
False negative: Failed association of one subject 1:1 FNMR 1:N FNIR
T 0 → FMR, FPIR → 0
→ FNMR, FNIR → 1

This publication is available free of charge from: https://doi.org/10.6028/NIST.IR.8280
2019/12/19 08:14:00 FRVT - FACE RECOGNITION VENDOR TEST - DEMOGRAPHICS 71
9 Research toward mitigation of false positives
9.1 Summary
The threshold manipulation strategies described above would be irrelevant if the algorithm developer pro-
vided software with homogeneous false match rates. That will prove impossible as there will always be some
distribution around a mean - the goal should be much more homogeneous false match rates than is currently
the case.
9.2 Algorithm training
A longer-term mitigation is prompted by our observation that many algorithms developed in China do not give
the elevated false positive rates on Chinese faces that algorithms developed elsewhere do. This affirms a prior
finding of an “other-race effect” for algorithms [33] though that paper did not separate false positive from false
negative shifts. This suggests that training data, or perhaps some other factor intrinsic to the development,
can be effective at reducing particular false positive differentials. Thus, the longer-term mitigation would be
for developers to investigate the utility of more diverse, globally derived, training data. Absent such data,
developers might consider whether their cost functions can be altered to reduce differentials. One developer
advanced such a concept in November 2018 [15].
9.3 Greater discriminative power
Face recognition algorithms measure similarity between face images. Facial appearance is partially determined
by genes, the phenotypic expression of which determines skin tone and a large set of characteristics related to
shape of the face. In NIST recognition tests [17], identical twins invariably cause false positives at all practical
operational thresholds. Twins are characterized by very similar features given identical genes. Similarities in
faces in fraternal twins [17] are expected to extend also to siblings (which also share half of the genes), and
then to more distant relatives. In 2004, an algorithm was patented that can correctly distinguish twins [US
Patent: US7369685B2]; it operates by extracting features from skin texture (adjacent to the nose, and above
the eyebrows). This algorithm requires high resolution and, moreover, knowledge that any given image has
that resolution. However, contemporary deployments of face recognition are very often based on processing
of images at or below VGA spatial sampling rates (i.e., 480 x 640 pixel images), and this is often insufficient
for skin texture to be viable. The human reviewer community has long specified much higher resolution for
forensic purposes (see ANSI/NIST Face Acquisition Profiles).
Links:
EXEC. SUMMARY
TECH. SUMMARY
False positive: Incorrect association of two subjects 1:1 FMR 1:N FPIR
False negative: Failed association of one subject 1:1 FNMR 1:N FNIR
T 0 → FMR, FPIR → 0
→ FNMR, FNIR → 1

This publication is available free of charge from: https://doi.org/10.6028/NIST.IR.8280
2019/12/19 08:14:00 FRVT - FACE RECOGNITION VENDOR TEST - DEMOGRAPHICS 72
9.4 Collection and use of face and iris
The texture of the human iris is known to have a structure that when imaged and processed by published
feature extraction algorithms [11, 29] will correctly discriminate between identical twins [40] - something that
contemporary marketplace face algorithms do not [17]. The reason for this appears to be that the iris features
detected by automated algorithms are not genetically determined. However genetics research [25] does show
iris textures have some genetic linkage, so a better characterisation of the tails of the impostor distribution is
needed, at least for large scale one-to-many identification. Nevertheless, a 2019 DHS Science and Technology
study noted that false positives are no higher within individuals of the same sex, age and race as they are
across those groups [39]. As shown in Figure 4 and Annex 8 that is not the case for face recognition. NIST has
near-term plans to investigate the impostor distribution in twins more fully.
Given the marketplace presence of multiple cameras that collect face and iris essentially simultaneously, one
approach to consider for mitigation of false positive differentials in face recognition would be for face records
to include adjunct iris images. The standards infrastructure is in place for this (ANSI/NIST Type 17, ISO/IEC
39794-6, and ICAO 9303 Data Group 4). This would afford very low false positive rates.
The apparent lack of genetic influence, and demonstrated low false match likelihoods, has been the primary
property in establishing the use of the iris for the identification of individuals in large populations - most
notably in the Indian National ID program Aadhaar. The iris recognition industry has multiple camera devel-
opers, multiple algorithm suppliers, and image interchange and quality standards that support interoperable
recognition across cameras.
These aspects afford solutions to higher and heterogeneous false positive rates in face recognition. The first is
simply to replace face with iris. There would be advantages and disadvantages to this - detailing and weighing
those is beyond our scope here. However a second solution would be to augment face with iris, to produce
a compound biometric “face-and-iris”
17
. This is made possible by the marketplace availability for at least a
decade now of cameras that collect iris and face images essentially simultaneously. Recognition of the com-
bined biometric would involve a particular kind of biometric fusion that in which both the face and iris must
match (against respective thresholds) so as to limit false positives. This differs from some convenience-driven
implementations that authenticate a person with either face or iris alone.
Use of iris in some applications, for example surveillance, is limited by the difficulty and expense of imaging
the iris at long distances.
We don’t mention fingerprints in this context because even though genetic influence is considered to be absent
17
Such a compound biometric would conventionally still require collection of two images: First an iris image with near infrared illumi-
nation and the face image either entirely in ambient light, or ambient light with a near infrared component. The recognition of irises
in purely visible-light images is highly problematic in brown-eyed people as melanin in the iris absorbs incident light at visible wave-
lengths.
Links:
EXEC. SUMMARY
TECH. SUMMARY
False positive: Incorrect association of two subjects 1:1 FMR 1:N FPIR
False negative: Failed association of one subject 1:1 FNMR 1:N FNIR
T 0 → FMR, FPIR → 0
→ FNMR, FNIR → 1
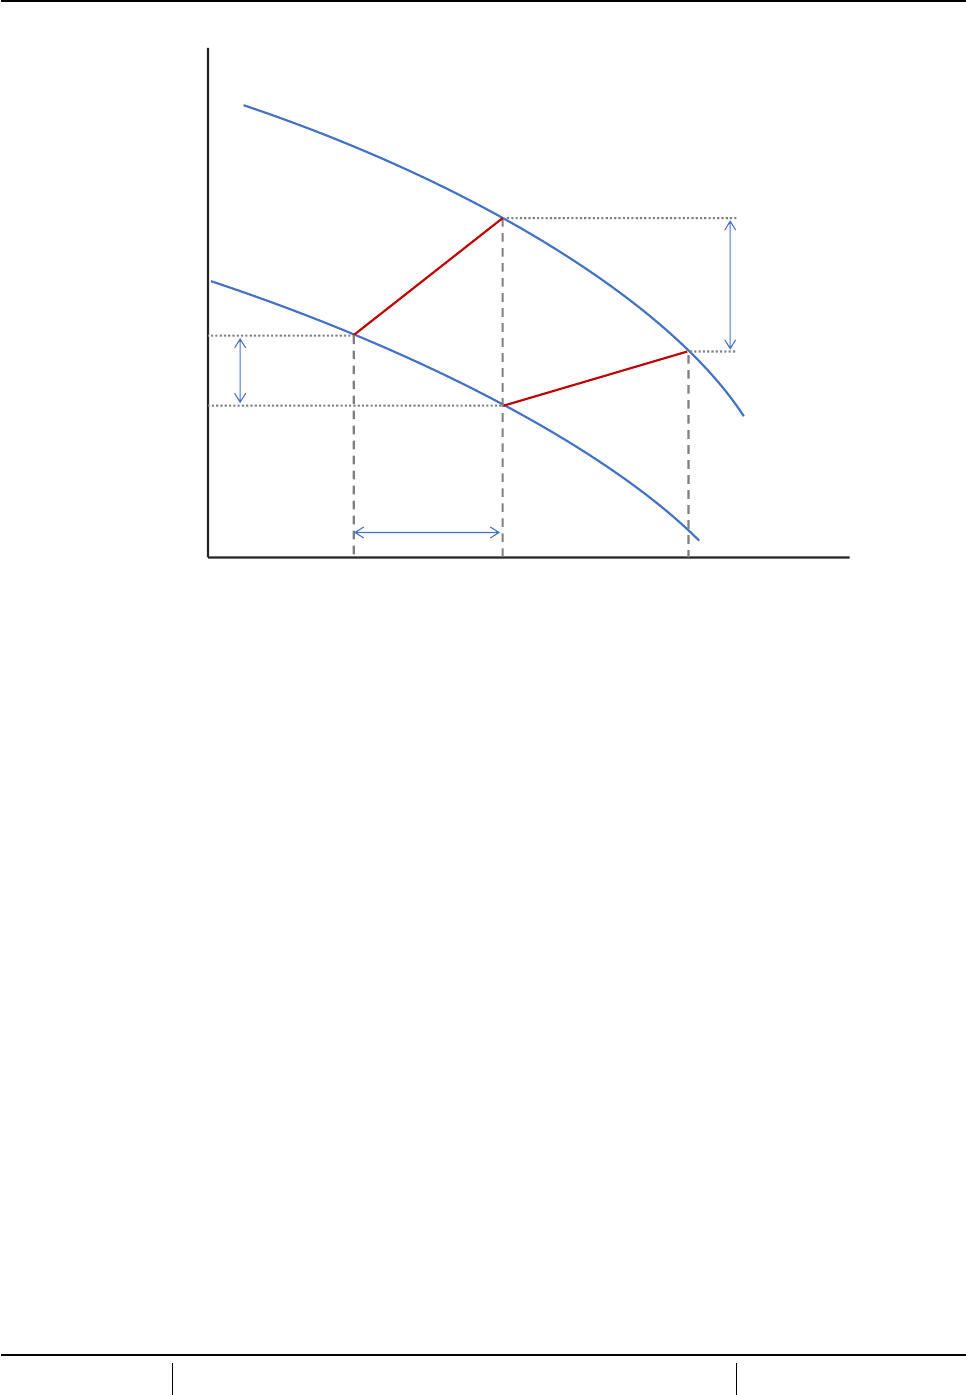
This publication is available free of charge from: https://doi.org/10.6028/NIST.IR.8280
2019/12/19 08:14:00 FRVT - FACE RECOGNITION VENDOR TEST - DEMOGRAPHICS 73
T
1
T
2
P1
P3
P4
∆FNMR
X
∆FNMR
Y
False Non-
Match
Rate
(FNMR)
False Match Rate (FMR)
Demographic Y
Demographic X
P2
FMR
POLICY
∆FMR
X
Figure 28: The figure shows the increases in FNMR implied by increasing the operating threshold to achieve the target
FMR on the high-FMR demographic, Y.
or minimal, the collection of both fingerprint and face is not simultaneous.
9.5 Threshold elevation
We detail one mitigation of heterogeneous variable false match rates, and its consequences, as follows. The
explanation uses a graphical construct based on the error tradeoff characteristics shown in Figure 28.
We start with a target false match rate FMR
POLICY
that has been set to implement some security ob-
jective. This value, in a verification application might reasonably be set to say 1 in 5000 (i.e. 0.0002).
This is implemented by setting a threshold T
1
. Suppose that this threshold was perfectly calibrated for
Demographic X i.e. FMR(T
1
) = FMR
POLICY
. This corresponds to the point P1.
Now suppose that we later discover, perhaps as a result of some biometric performance test or audit
that, for some new group Demographic Y, that the observed false match rate at the fixed threshold T
1
is
much higher, a factor of five say (0.001). This point P2 therefore represents therefore a failure to meet the
original security objective for that group.
To bring the overall system into policy compliance, the system owner consults the error tradeoff charac-
Links:
EXEC. SUMMARY
TECH. SUMMARY
False positive: Incorrect association of two subjects 1:1 FMR 1:N FPIR
False negative: Failed association of one subject 1:1 FNMR 1:N FNIR
T 0 → FMR, FPIR → 0
→ FNMR, FNIR → 1

This publication is available free of charge from: https://doi.org/10.6028/NIST.IR.8280
2019/12/19 08:14:00 FRVT - FACE RECOGNITION VENDOR TEST - DEMOGRAPHICS 74
T
X
False Non-
Match
Rate
(FNMR)
False Match Rate (FMR)
Demographic Z
Demographic X
FMR
POLICY
Demographic Y
T
X
T
X
T
Y
T
Z
Figure 29: The figure shows the effect of setting thresholds to achieve the target FMR on demographics X and Y.
teristic for Demographic Y and notes that by elevating the threshold to T
2
, the false match rate would be
returned to policy compliance, at point P3.
The effect of this however is that FNMR is necessarily elevated both demographic groups. This is be-
cause the new threshold T
2
is higher than T
1
, and applies to all transactions from all demographics.
These increases are shown as ∆FNMR
X
and ∆FNMR
Y
would have a magnitude that depends on the
gradients of the error-tradeoff characteristics (which may differ). The only gain is a reduction in FMR for
Demographic X, to a value which beats the original target policy.
Using this kind of construct, we see the benefit in having a biometric algorithm for which false match rates are
homogenous i.e. do not vary (much) over any demographics.
The above argument assumes that the original high FMR
Y
(T
1
) is indeed problematic. It may be tolerable in
cases where individuals in that Demographic are rare, e.g. elderly persons entering a gym or nightclub. Any
decision to not elevate the threshold to T
2
should be deliberated in the security context defined by threat, risk
and cost.
Links:
EXEC. SUMMARY
TECH. SUMMARY
False positive: Incorrect association of two subjects 1:1 FMR 1:N FPIR
False negative: Failed association of one subject 1:1 FNMR 1:N FNIR
T 0 → FMR, FPIR → 0
→ FNMR, FNIR → 1

This publication is available free of charge from: https://doi.org/10.6028/NIST.IR.8280
2019/12/19 08:14:00 FRVT - FACE RECOGNITION VENDOR TEST - DEMOGRAPHICS 75
9.6 Explicit thresholds for each demographic
In this section we discuss the suggestion [23] to address heterogeneous false match rates by assigning a thresh-
old to each demographic. The proposal is for a verification system to set the threshold each time a subject
executes a verification transaction tailoring it on the basis of who is using the system. Referencing Figure 29,
this would correspond to adopting thresholds T
1
and T
2
(i.e. points P1 and P3) on-the-fly. How to do this
presents a problem. Naively one could encode in an identity document (e.g. a passport) some indication of
the demographic group (e.g. female, middle aged, south Asian) and the system would read this information,
consult a lookup table, and set T accordingly. This would be effective for genuine legitimate users of the sys-
tem. The security consequences of this are, however, more complicated. Consider what an imposter would do
given knowledge that thresholds are variable.
If the imposter were from a demographic for which the threshold is low, he would procure / steal a
credential from somebody of the same age, sex and ethnicity. This would be typical behavior for any
imposter. However, if particular countries passports were known to be used with low-thresholds, we’d
expect genesis of a black-market for stolen credentials in those places.
If the imposter were from a demographic for which the threshold is high he might procure / steal a
credential from somebody in one of the low-threshold demographics, matching age and sex minimally
the same sex. To better induce a false match the imposter would still need to have the same age, sex and
ethnicity. This would be typical behavior anyway.
Note that societal construction will often naturally afford opportunities for imposters to have access to
identity credentials from other persons who, naturally, have the same ethnicity, sex and age group.
Another aspect to this approach is that it shifts responsibility for threshold management to the system owner
rather than the developer. That may sound fully appropriate but imposes two responsibilities on the operator:
First, figuring out what the thresholds should be via some appropriate testing, and secondly to implement the
strategy with capture of demographic information and use of that in software.
Links:
EXEC. SUMMARY
TECH. SUMMARY
False positive: Incorrect association of two subjects 1:1 FMR 1:N FPIR
False negative: Failed association of one subject 1:1 FNMR 1:N FNIR
T 0 → FMR, FPIR → 0
→ FNMR, FNIR → 1

This publication is available free of charge from: https://doi.org/10.6028/NIST.IR.8280
2019/12/19 08:14:00 FRVT - FACE RECOGNITION VENDOR TEST - DEMOGRAPHICS 76
References
[1] December 2016. https://www.telegraph.co.uk/technology/2016/12/07/robot-passport-checker-rejects-
asian-mans-photo-having-eyes/.
[2] Artem Babenko and Victor Lempitsky. Efficient indexing of billion-scale datasets of deep descriptors. In
The IEEE Conference on Computer Vision and Pattern Recognition (CVPR), June 2016.
[3] L. Best-Rowden and A. K. Jain. Longitudinal study of automatic face recognition. IEEE Transactions on
Pattern Analysis and Machine Intelligence, 40(1):148–162, Jan 2018.
[4] J. Ross Beveridge, Geof H. Givens, P. Jonathon Phillips, and Bruce A. Draper. Factors that influence
algorithm performance in the face recognition grand challenge. Computer Vision and Image Understanding,
113(6):750–762, 2009.
[5] Joy Buolamwini. Gender shades: Intersectional phenotypic and demographic evaluation of face datasets
and gender classifiers. Technical report, MIT Media Lab, 01 2017.
[6] J. Campbell and M. Savastano. Iso/iec 22116 identifying and mitigating the differential impact of de-
mographic factors in biometric systems. Technical report, ISO/IEC JTC 1, SC 37, Working Group 6,
http://iso.org/standard/72604.html, 11 2018.
[7] Jacqueline G. Cavazos, Eilidh Noyes, and Alice J. O’Toole. Learning context and the other-race effect:
Strategies for improving face recognition. Vision Research, 157:169 – 183, 2019. Face perception: Experience,
models and neural mechanisms.
[8] Jacqueline G. Cavazos, P. Jonathon Phillips, Carlos D. Castillo, and Alice J. O’Toole. Accuracy
comparison across face recognition algorithms: Where are we on measuring race bias? In
https://arxiv.org/abs/1912.07398, 12 2019.
[9] Cynthia Cook, John Howard, Yevgeniy Sirotin, Jerry Tipton, and Arun Vemury. Demographic effects
in facial recognition and their dependence on image acquisition: An evaluation of eleven commercial
systems. IEEE Transactions on Biometrics, Behavior, and Identity Science, PP:1–1, 02 2019.
[10] White D., Kemp R. I., Jenkins R., Matheson M, and Burton A. M. Passport officers errors in face matching.
PLoS ONE, 9(8), 2014. e103510. doi:10.1371/journal. pone.0103510.
[11] J. Daugman. How iris recognition works. IEEE Transactions on Circuits and Systems for Video Technology,
14(1):21–30, Jan 2004.
Links:
EXEC. SUMMARY
TECH. SUMMARY
False positive: Incorrect association of two subjects 1:1 FMR 1:N FPIR
False negative: Failed association of one subject 1:1 FNMR 1:N FNIR
T 0 → FMR, FPIR → 0
→ FNMR, FNIR → 1

This publication is available free of charge from: https://doi.org/10.6028/NIST.IR.8280
2019/12/19 08:14:00 FRVT - FACE RECOGNITION VENDOR TEST - DEMOGRAPHICS 77
[12] Itiel Dror and Kasey Wertheim. Quantified assessment of afis contextual information on accuracy and
reliability of subsequent examiner conclusions. Technical Report 235288, National Institute of Justice, July
2011.
[13] H El Khiyari and Wechsler H. Face verification subject to varying (age, ethnicity, and gender) demo-
graphics using deep learning. Journal of Biometrics and Biostatistics, 7:323, 11 2016. doi:10.4172/2155-
6180.1000323.
[14] C. Garvie, A. Bedoya, and J. Frankle. The perpetual line-up: Unregulated police face recognition in
america. Technical report, Georgetown University Law School, Washington, DC, 10 2018.
[15] St
´
ephane Gentric. Face recognition evaluation @ idemia. In Proc. International Face Performance Conference,
National Institute of Standards and Technology NIST, Gaithersburg, MD, November 2018.
[16] Patrick Grother, Mei Ngan, and Kayee Hanaoka. Face recognition vendor test (frvt) part 1: Veri-
fication. Interagency Report DRAFT, National Institute of Standards and Technology, October 2019.
https://nist.gov/programs-projects/frvt-11-verification.
[17] Patrick Grother, Mei Ngan, and Kayee Hanaoka. Face recognition vendor test (frvt) part 2: Identi-
fication. Interagency Report 8271, National Institute of Standards and Technology, September 2019.
https://doi.org/10.6028/NIST.IR.8271.
[18] Patrick Grother, George W. Quinn, and Mei Ngan. Face recognition vendor test - still face image and
video concept, evaluation plan and api. Technical report, National Institute of Standards and Technology,
7 2013. http://biometrics.nist.gov/cs links/face/frvt/frvt2012/NIST FRVT2012 api Aug15.pdf.
[19] Feng Hao, John Daugman, and Piotr Zielinski. A fast search algorithm for a large fuzzy database. IEEE
Transactions on Information Forensics and Security, 3(2):203–212, 2008.
[20] John J. Howard, Yevgeniy Sirotin, and Arun Vermury. The effect of broad and specific demographic ho-
mogeneity on the imposter distributions and false match rates in face recognition algorithm performance.
In Proc. 10-th IEEE International Conference on Biometrics Theory, Applications and Systems, BTAS 2019, Tampa
Florida,USA, September 2019.
[21] Masato Ishii, Hitoshi Imaoka, and Atsushi Sato. Fast k-nearest neighbor search for face identification
using bounds of residual score. In 2017 12th IEEE International Conference on Automatic Face & Gesture
Recognition (FG 2017), pages 194–199, Los Alamitos, CA, USA, May 2017. IEEE Computer Society.
[22] B. F. Klare, Burge M. J., Klontz J. C., Vorder Bruegge R. W., and Jain A. K. Face recognition performance:
Role of demographic information. IEEE Trans. on Information Forensics and Security, 7(6):1789–1801, 9 2012.
Links:
EXEC. SUMMARY
TECH. SUMMARY
False positive: Incorrect association of two subjects 1:1 FMR 1:N FPIR
False negative: Failed association of one subject 1:1 FNMR 1:N FNIR
T 0 → FMR, FPIR → 0
→ FNMR, FNIR → 1

This publication is available free of charge from: https://doi.org/10.6028/NIST.IR.8280
2019/12/19 08:14:00 FRVT - FACE RECOGNITION VENDOR TEST - DEMOGRAPHICS 78
[23] K. S. Krishnapriya, Kushal Vangara, Michael C. King, Vitor Albiero, and Kevin Bowyer. Charac-
terizing the variability in face recognition accuracy relative to race. CoRR, abs/1904.07325, 2019.
http://arxiv.org/abs/1904.07325.
[24] K. S. Krishnapriya, Kushal Vangara, Michael C. King, Vitor Albiero, and Kevin Bowyer. Us study: better
image quality could cut face system bias. Biometric Technology Today, 2019(5):11 – 12, 2019.
[25] Mats Larsson, David L. Duffy, Gu Zhu, Jimmy Z. Liu, Stuart Macgregor, Allan F. McRae, Margaret J.
Wright, Richard A. Sturm, David A. Mackey, Grant W. Montgomery, Nicholas G. Martin, and Sarah E.
Medland. GWAS findings for human iris patterns: Associations with variants in genes that influence
normal neuronal pattern development. American Journal of Human Genetics, 89(2):334–343, August 2011.
[26] Yury A. Malkov and D. A. Yashunin. Efficient and robust approximate nearest neighbor search using
hierarchical navigable small world graphs. CoRR, abs/1603.09320, 2016.
[27] Joyce A. Martin, Brady E. Hamilton, Michelle J.K. Osterman, Anne K. Driscoll, , and Patrick Drake. Na-
tional vital statistics reports. Technical Report 8, Centers for Disease Control and Prevention, National
Center for Health Statistics, National Vital Statistics System, Division of Vital Statistics, November 2018.
[28] Dana Michalski, Sau Yee Yiu, and Chris Malec. The impact of age and threshold variation on facial
recognition algorithm performance using images of children. In International Conference on Biometrics,
February 2018.
[29] D. M. Monro, S. Rakshit, and D. Zhang. Dct-based iris recognition. IEEE Transactions on Pattern Analysis
and Machine Intelligence, 29(4):586–595, April 2007.
[30] Vidya Muthukumar. Color-theoretic experiments to understand unequal gender classification accuracy
from face images. In The IEEE Conference on Computer Vision and Pattern Recognition (CVPR), June 2019.
[31] Vidya Muthukumar, Tejaswini Pedapati, Nalini Ratha, Prasanna Sattigeri, Chai-Wah Wu, Brian Kings-
bury, Abhishek Kumar, Samuel Thomas, Aleksandra Mojsilovic, and Kush R. Varshney. Understanding
unequal gender classification accuracy from face images. CoRR, abs/1812.00099, November 2018.
[32] P. Jonathon Phillips, J. Beveridge, Bruce Draper, Geof Givens, Alice O’Toole, David Bolme, Joseph Dunlop,
Yui Lui, Hassan Sahibzada, and Samuel Weimer. The good, the bad, and the ugly face challenge problem.
Image and Vision Computing, 30:177185, 03 2012.
[33] P. Jonathon Phillips, Fang Jiang, Abhijit Narvekar, Julianne Ayyad, and Alice J. O’Toole. An other-race
effect for face recognition algorithms. ACM Trans. Appl. Percept., 8(2):14:1–14:11, February 2011.
Links:
EXEC. SUMMARY
TECH. SUMMARY
False positive: Incorrect association of two subjects 1:1 FMR 1:N FPIR
False negative: Failed association of one subject 1:1 FNMR 1:N FNIR
T 0 → FMR, FPIR → 0
→ FNMR, FNIR → 1

This publication is available free of charge from: https://doi.org/10.6028/NIST.IR.8280
2019/12/19 08:14:00 FRVT - FACE RECOGNITION VENDOR TEST - DEMOGRAPHICS 79
[34] P. Jonathon Phillips, Amy N. Yates, Ying Hu, Carina A. Hahn, Eilidh Noyes, Kelsey Jackson, Jacque-
line G. Cavazos, G
´
eraldine Jeckeln, Rajeev Ranjan, Swami Sankaranarayanan, Jun-Cheng Chen, Carlos D.
Castillo, Rama Chellappa, David White, and Alice J. O’Toole. Face recognition accuracy of forensic exam-
iners, superrecognizers, and face recognition algorithms. Proceedings of the National Academy of Sciences,
115(24):6171–6176, 2018.
[35] P.J. Phillips, P. Grother, R. J. Micheals, D. M. Blackburn, E. Tabassi, and M. Bone. Face recogni-
tion vendor test 2002. Evaluation Report IR 6965, National Institute of Standards and Technology,
www.itl.nist.gov/iad/894.03/face/face.html or www.frvt.org, March 2003.
[36] Inioluwa Raji and Joy Buolamwini. Actionable auditing: Investigating the impact of publicly naming
biased performance results of commercial AI products. In Conference on AI, Ethics and Society, pages 429–
435, 01 2019.
[37] K. Ricanek and T. Tesafaye. Morph: a longitudinal image database of normal adult age-progression. In
7th International Conference on Automatic Face and Gesture Recognition (FGR06), pages 341–345, April 2006.
[38] K. Simonyan and A. Zisserman. Very deep convolutional networks for large-scale image recognition.
In Proc. International Conference on Learning Representations, volume https://arxiv.org/abs/1409.1556v6,
2015.
[39] Yevgeniy Sirotin. A comparison of demographic effects in face and iris recognition. Technical report, Iris
Experts Group, Gaithersburg, MD, 6 2019.
[40] Zhenan Sun, Alessandra Paulino, Jianjiang Feng, Zhenhua Chai, Tieniu Tan, and Anil Jain. A study of
multibiometric traits in identical twins. Proc. of the International Society of Optical Engineering, 7667, 04 2010.
[41] Darrell M. West. 10 actions that will protect people from facial recognition software. Technical report,
Brookings Institution, Artificial Intelligence and Emerging Technology Initiative, Washington, DC, 10
2019.
[42] David White, James D. Dunn, Alexandra C. Schmid, and Richard I. Kemp. Error rates in users of automatic
face recognition software. PLoS ONE, October 2015.
Links:
EXEC. SUMMARY
TECH. SUMMARY
False positive: Incorrect association of two subjects 1:1 FMR 1:N FPIR
False negative: Failed association of one subject 1:1 FNMR 1:N FNIR
T 0 → FMR, FPIR → 0
→ FNMR, FNIR → 1
