
Desiree Carver-Thomas and Linda Darling-Hammond
Teacher Turnover:
Why It Matters and
What We Can Do About It
AUGUST 2017
Teacher Turnover:
Why It Matters and
What We Can Do About It
Desiree Carver-Thomas and Linda Darling-Hammond

LEARNING POLICY INSTITUTE | TEACHER TURNOVER: WHY IT MATTERS AND WHAT WE CAN DO ABOUT IT
Suggested citation: Carver-Thomas, D. & Darling-Hammond, L. (2017). Teacher turnover: Why it
matters and what we can do about it. Palo Alto, CA: Learning Policy Institute.
The report can be found online at https://learningpolicyinstitute.org/product/teacher-turnover.
This work is licensed under the Creative Commons Attribution—NonCommercial 4.0 International
License. To view a copy of this license, visit http://creativecommons.org/licenses/by-nc/4.0/.
Acknowledgments
The authors would like to thank Larry Rosenthal, Senior Lecturer of Public Policy at University of
California, Berkeley, for his insights and advice. We also thank the following LPI colleagues for their
valuable feedback: Leib Sutcher, Roneeta Guha, Tara Kini, and the entire Educator Quality team. We
thank Bulletproof Services and Penelope Malish for their editing and design contributions to this
project, and Lisa Gonzales for overseeing the editorial process.
Research in this area of work is funded in part by the S. D. Bechtel, Jr. Foundation. Core operating
support for the Learning Policy Institute is provided by the Ford Foundation, the William and Flora
Hewlett Foundation, and the Sandler Foundation.
External Reviewers
This report beneted from the insights and expertise of two external reviewers: Li Feng, Brandon
Dee Roberts Excellence Assistant Professor at Texas State University; and Jesse Rothstein, Professor
of Public Policy and Economics and Director of the Institute for Research on Labor and Employment
at University of California, Berkeley. We thank them for the care and attention they gave the report.
Any remaining shortcomings are our own.
LEARNING POLICY INSTITUTE | TEACHER TURNOVER: WHY IT MATTERS AND WHAT WE CAN DO ABOUT IT
Table of Contents
Executive Summary.................................................................................................................................. v
Introduction ...............................................................................................................................................1
Trends in Teacher Turnover .....................................................................................................................3
National Trends ..............................................................................................................................3
Regional and State-by-State Trends ...............................................................................................9
Subject-Area Turnover ................................................................................................................. 11
Turnover in Schools Serving Historically Underserved Students ................................................ 14
Turnover of Teachers of Color ..................................................................................................... 20
Predictors of Turnover ........................................................................................................................... 24
School Characteristics ................................................................................................................ 24
Teacher Characteristics .............................................................................................................. 25
Main Teaching Subject Area ....................................................................................................... 27
Teaching Conditions .................................................................................................................... 29
Summary of Findings ............................................................................................................................ 30
Policy Considerations ............................................................................................................................ 32
Compensation ............................................................................................................................. 32
Teacher Preparation and Support ............................................................................................... 33
School Leadership ...................................................................................................................... 34
Conclusion .............................................................................................................................................. 34
Technical Appendix ............................................................................................................................... 35
Data............................................................................................................................................. 35
Methodology ............................................................................................................................... 35
Endnotes ................................................................................................................................................. 43
About the Authors ................................................................................................................................. 48
List of Figures and Tables
Figure 1: Rate of Leaving Teaching Has Increased .........................................................................3
Figure 2: Sources of Teacher Turnover, 2011–12 to 2012–13 ....................................................4
Figure 3: Occupational Status of Leavers .......................................................................................5
Figure 4: Factors Teachers Report as Being Very Important for Leaving Teaching ........................6
Figure 5: Factors Teachers Report as Being Very Important Reasons for Moving .........................6
Figure 6: Turnover Rates Vary by Region and District Type ......................................................... 10
Figure 7: Teacher Turnover Varies Widely by State ...................................................................... 11
Figure 8: Turnover Rates Vary by Primary Teaching Assignment ................................................. 12
LEARNING POLICY INSTITUTE | TEACHER TURNOVER: WHY IT MATTERS AND WHAT WE CAN DO ABOUT IT iv
Figure 9: Teacher Turnover Is Greater in Title I Schools .............................................................. 15
Figure 10: Teachers in Title I Schools Stay Fewer Years ................................................................ 16
Figure 11: Teachers in Title I Schools Have Fewer Years of Experience ....................................... 16
Figure 12: Teacher Turnover Is Greater When Schools Serve Primarily Students of Color ............ 17
Figure 13: Teachers in Schools Serving Primarily Students of Color Stay Fewer Years ................ 18
Figure 14: Teachers at Schools Serving Primarily Students of Color Have Less
Overall Experience ........................................................................................................ 19
Figure 15: Teacher Leaving Rate, 1988–89 to 2012–13 ............................................................ 21
Figure 16: Teacher Moving Rate, 1988–89 to 2012–13 ............................................................. 21
Figure 17: Teacher Leaver and Mover Rates, 2012 ...................................................................... 22
Figure 18: Predicted Turnover Rate by Population of Students of Color ....................................... 25
Figure 19: Predicted Turnover Rate by Population of Students of Color and
Teacher Preparation Pathway ....................................................................................... 26
Figure 20: Predicted Turnover Rates by Subject Area .................................................................... 27
Figure 21: Predicted Turnover Rate by Highest District Salary ...................................................... 28
Figure 22: Predicted Turnover Rate by Teacher Report of Administrative Support ....................... 29
Table 1: Teacher Reasons for Leaving ...........................................................................................7
Table 2: Change in Proportion of Teachers in Selected Cities by
Teacher Race, 2000–12 .............................................................................................. 23
Table A-1: Independent Variable Means for Teachers Overall; Teachers of Color;
Mathematics, Science, and Special Education; and
Teachers from Alternative Pathways ............................................................................. 40
Table A-2: Logistic Regression Odds Ratios: Probability of Teachers Moving or Leaving ............. 41
LEARNING POLICY INSTITUTE | TEACHER TURNOVER: WHY IT MATTERS AND WHAT WE CAN DO ABOUT IT v
Executive Summary
Growing teacher shortages nationally have made lling vacancies with qualied teachers increasingly
difcult. Curbing teacher turnover—that is, all teacher movement out of schools or out of the
profession—can go a long way toward solving shortages. About 90% of the nationwide annual demand
for teachers is created when teachers leave the profession, with two-thirds of teachers leaving for
reasons other than retirement. If school systems can address the factors that create high turnover,
they can reduce the demand for teachers who are in short supply.
Not only does turnover contribute to shortages, teacher movement out of schools and out of
teaching creates costs for the schools they leave behind. Estimates exceed $20,000 to replace
each teacher who leaves an urban school district. Most importantly, high turnover rates reduce
achievement for students whose classrooms are directly affected, as well as for other students in the
school.
Our analysis of nationally representative survey data from the 2012 Schools and Stafng Survey
and the 2013 Teacher Follow-up Survey reveals that the severity of turnover varies markedly
across the country:
• Total turnover rates are highest in the South (16.7%) and lowest in the Northeast (10.3%),
where states tend to offer higher pay, support smaller class sizes, and make greater
investments in education.
• Teachers of mathematics, science, special education, English language development, and
foreign languages are more likely to leave their school or the profession than those in other
elds. These are teaching elds that experience shortages in most states across the country.
• Turnover rates are 50% higher for teachers in Title I schools, which serve more low-income
students. Mathematics and science teacher turnover rates are nearly 70% greater in Title I
schools than in non-Title I schools, and turnover rates for alternatively certied teachers
are more than 80% higher.
• Turnover rates are 70% higher for teachers in schools serving the largest concentrations of
students of color. These schools are staffed by teachers who have fewer years of experience
and, often, signicantly less training to teach. Teacher turnover rates are 90% higher
in the top quartile of schools serving students of color than in the bottom quartile for
mathematics and science teachers, 80% higher for special education teachers, and 150%
higher for alternatively certied teachers.
• Teachers of color—who disproportionately teach in high-minority, low-income schools and
who are also signicantly more likely to enter teaching without having completed their
training—have higher turnover rates than White teachers overall (about 19% versus about
15%). While they leave at higher rates than White teachers generally, their turnover rates
are about the same as those of all other teachers in high-poverty and high-minority schools.
Teachers cite a number of reasons for leaving their school or the profession. The most frequently
cited reasons in 2012–13 were dissatisfactions with testing and accountability pressures (listed
by 25% of those who left the profession); lack of administrative support; dissatisfactions with the
teaching career, including lack of opportunities for advancement; and dissatisfaction with working
conditions. These kinds of dissatisfactions were noted by 55% of those who left the profession and
66% of those who left their school to go to another school.

LEARNING POLICY INSTITUTE | TEACHER TURNOVER: WHY IT MATTERS AND WHAT WE CAN DO ABOUT IT vi
Personal and nancial reasons were also cited, along with the desire to take another kind of job or to
retire.
Among the key variables that drive turnover
are the kind of preparation teachers have had
prior to entry and the kind of administrative
support they receive on the job. In an analysis of
predictors of turnover in which we controlled for
a large number of student, teacher, and school
characteristics, we found that:
• Teachers who enter the profession
through alternative certication
pathways—who have had less
coursework and student teaching, on average, than teachers who are prepared through
traditional programs—are 25% more likely to leave their schools and the profession, even
after controlling for their students, schools, and teaching conditions.
• Teachers of mathematics or science, special education, or foreign languages were much
more likely to leave their schools or the profession in comparison with elementary school
teachers. Holding all else constant, mathematics and science teachers have a predicted
turnover rate 37% greater than that of elementary school teachers, special education
teachers have a rate 46% higher, and foreign language teachers have a rate 87% higher.
• Teacher reports of a lack of administrative support have the strongest relationship with
teacher turnover. In a model controlling for other factors, teachers who strongly disagree
that their administration is supportive are more than twice as likely to leave their school or
teaching than teachers who strongly agree their administration is supportive.
• Controlling for other factors, teachers in districts with a maximum teacher salary greater
than $72,000 are 20% to 31% less likely to leave their schools than those in districts with
maximum salaries under $60,000.
Turnover was also higher for teachers in small schools and for those under 30 or over 50, as
compared to those in mid-career. Having controlled for school size and location and other student,
teacher, and school characteristics, no other teaching conditions proved to be signicant predictors
of teacher turnover.
Recommendations
To stem teacher turnover, federal, state, and district policymakers should consider improving the
key factors associated with teacher turnover: compensation, teacher preparation and support, and
school leadership.
Compensation
• Provide compensation packages that are competitive with those of other occupations
requiring similar levels of education and that are equitable across districts, so all schools
can compete in the labor market for well-prepared teachers.
• Offer service scholarship and loan forgiveness programs that reduce the debt burden
Among the key variables that
drive turnover are the kind of
preparation teachers have had
prior to entry and the kind of
administrative support they
receive on the job.
LEARNING POLICY INSTITUTE | TEACHER TURNOVER: WHY IT MATTERS AND WHAT WE CAN DO ABOUT IT vii
of teaching and encourage entry into the profession through high-retention pathways
that provide comprehensive preparation with strong clinical training. These programs
pay the cost of teacher preparation in exchange for a commitment to teach in a subject
or location of need for 3 to 5 years and can be targeted to the subjects and schools where
teachers are least likely to be well prepared and where turnover is greatest: mathematics,
science, special education, and in schools serving primarily students of color and students
in poverty.
Teacher Preparation and Support
• Establish other high-retention pathways into teaching that explicitly serve high-need
communities, such as teacher residency programs. Based on the medical residency
model, residents train in high-needs schools for an entire school year under the guidance
and supervision of a master teacher, while earning a credential and a master’s degree
from a partnering university. Most programs offer tuition assistance and a stipend for
living expenses, plus two years of mentoring after the training year. In exchange, residents
commit to teaching in the district for 3 to 5 years after their residency year. These programs
tend to have much higher than average teacher retention rates.
• Develop “Grow Your Own” teacher preparation models for hard-to-staff communities
that can recruit local high school students, paraprofessionals, after-school program staff,
or other local community members into teaching. These models capitalize on the fact that
teachers are more likely to stay and continue teaching in their own communities. Grow your
own models often underwrite the costs of teacher training through the kind of high-quality
preparation programs associated with improved teacher retention, while they also provide
supports for candidates to succeed.
• Provide high-quality mentoring and induction to beginning teachers that helps teachers
learn to teach effectively in high-need schools. High-quality induction programs that
reduce attrition include mentoring with observation and feedback, time for collaborative
planning with colleagues, a reduced teaching load, and a focus on high-leverage activities—
such as analyzing student work and discussing instructional strategies.
School Leadership
• Develop rigorous accreditation and licensure standards for principal training
programs aligned with research on effective school leadership, as well as systems for
regular program review by qualied experts.
• Fund residencies for principal training and state leadership academies that coordinate
mentoring and professional learning to develop school leadership capacity to build and
nurture collegial school settings that encourage teacher retention.
• Create systems and resources for developing robust leadership pipelines within districts
to ll positions districtwide and targeted to the schools in greatest need.
Effectively retaining teachers is crucial to ensuring there are enough well-prepared and committed
teachers to staff all of our nation’s schools and that the teachers in our classrooms have the
experience and expertise to effectively serve all students. Tailored policy interventions can play a
role in addressing the key factors that drive teachers from their schools, stabilizing and ultimately
improving the teacher workforce so that it can serve all students well.
LEARNING POLICY INSTITUTE | TEACHER TURNOVER: WHY IT MATTERS AND WHAT WE CAN DO ABOUT IT viii

LEARNING POLICY INSTITUTE | TEACHER TURNOVER: WHY IT MATTERS AND WHAT WE CAN DO ABOUT IT 1
Introduction
With the U.S. facing a national teacher shortage that is projected to grow substantially in the
coming years, school systems across the country are grappling with the challenge of building
and maintaining a high-quality teacher workforce for all students.
1
While school leaders and
policymakers might be tempted to solve shortages by focusing solely on teacher recruitment
strategies, a better approach begins with understanding teacher attrition and turnover.
A high rate of teacher attrition—that is,
teachers leaving the profession—is a primary
contributor to teacher shortages nationally.
The profession has a national attrition rate of
about 8% annually, and research shows that the
number of teachers leaving each year accounts
for close to 90% of annual teacher demand.
2
Furthermore, less than a third of national
teacher attrition is due to retirement. In other
words, each year schools nationwide must
hire tens of thousands of teachers as a result of beginning and mid-career teachers leaving the
profession.
Teacher turnover can also contribute to labor market imbalances. When teachers move between
schools, even if they stay in the profession, the effect on the schools they leave is essentially the
same as if they had left teaching altogether. In times of shortage, teachers who shift between
schools, known as “movers,” can further exacerbate hiring difculties in the hardest-hit schools.
Researchers agree that teacher turnover is to be expected, and, indeed, some amount of turnover
can be benecial as teachers nd schools or professions that are the right t. That said, teacher
turnover takes a toll on schools and students. In particular, when turnover contributes to teacher
shortages, schools often respond by hiring inexperienced or unqualied teachers, increasing class
sizes, or cutting class offerings, all of which impact student learning.
3
Research is clear that both
teacher inexperience and rates of turnover negatively impact student learning,
4
which means that
students in schools with high turnover and few experienced teachers are at a decided educational
disadvantage.
In addition, turnover impacts the achievement of all students in a school, not just those with a new
teacher, by disrupting school stability, collegial relationships, collaboration, and the accumulation
of institutional knowledge.
5
Financial costs also accrue when replacing teachers, with estimates
reaching $20,000 or more for each teacher who leaves an urban district.
6
The costs of teacher turnover are disproportionately borne by students in hard-to-staff schools,
typically those serving primarily students of color and students in poverty, which are more likely to
rely upon uncertied teachers who are often hired as a last resort when fully certied teachers are
not available. In 2013–14, the quarter of schools enrolling the most students of color nationally had
four times as many uncertied teachers as the quarter of schools enrolling the fewest students of
color. Uncertied teachers were also more common in schools serving the most students eligible for
free and reduced-price lunch than in those with the fewest.
7
Each year schools nationwide
must hire tens of thousands of
teachers as a result of beginning
and mid-career teachers leaving
the profession.
LEARNING POLICY INSTITUTE | TEACHER TURNOVER: WHY IT MATTERS AND WHAT WE CAN DO ABOUT IT 2
This report uses data from the most recent nationally representative survey of U.S. teachers
(Restricted-Use Schools and Stafng Survey [SASS] 2011–12 and Teacher Follow-Up Survey [TFS]
2012–13) to investigate how turnover trends vary across teachers and schools. Given the signicant
role turnover plays in teacher shortages, this report discusses turnover trends in major subject areas
that commonly suffer shortages—mathematics, science, special education, and English language
development—as well as among teachers of color and in high-poverty and high-minority schools.
We begin with an overview of trends in teacher attrition and turnover, nationally and regionally. We
then look at these trends by subject area and by teacher and school characteristics. Next, we discuss
predictors of teacher turnover that have been surfaced in previous research and test them with the
most recent national data. We end with a discussion of policy considerations, based on research on
stemming teacher turnover.

LEARNING POLICY INSTITUTE | TEACHER TURNOVER: WHY IT MATTERS AND WHAT WE CAN DO ABOUT IT 3
Trends in Teacher Turnover
Teacher turnover varies considerably across states and regions of the country, among and
within school districts, and among teachers of different types. Below, we discuss the variation in
turnover trends, including nationally; regionally; in math, science, special education, and English
language development; in schools serving students in poverty and students of color; and among
teachers of color.
National Trends
The percentage of teachers leaving the
profession—known as “leavers”—has increased
substantially over the past two decades: 5.1%
of public school teachers left the workforce in
1992, while 8.4% left in 2005. Attrition rates have
continued to hover around 8% since then (see
Figure 1).
8
The 3% increase in attrition rates is
not trivial: It amounts to about 90,000 additional
teachers needing to be hired across the U.S. each
year. In high-achieving school systems such as those in Finland, Singapore, and Ontario, Canada,
annual teacher attrition rates typically average as low as 3% to 4%.
9
If attrition rates in the U.S.
could be reduced by half to be more comparable with these systems, the national teacher shortage
could be virtually eliminated.
10
The percentage of teachers
leaving the profession has
increased substantially over the
past two decaeds.
Figure 1
0%
2%
4%
6%
8%
10%
12%
14%
16%
18%
Source: National Center for Education Statistics Schools and Staffing Survey; Goldring, R., Taie, S., & Riddles, M. (2014).
Teacher Attrition and mobility: Results from the 2012–13 Teacher Follow-Up Survey. National Center for Education Statistics.
Rate of Leaving Teaching Has Increased
PERCENTAGE OF TEACHERS
1988–89 1991–92 1994–95 2000–01 2004–05 2008–09 2012–13
■ Leavers ■ Movers

LEARNING POLICY INSTITUTE | TEACHER TURNOVER: WHY IT MATTERS AND WHAT WE CAN DO ABOUT IT 4
In addition to the 8% of teachers who leave the
profession each year, about 8% shift schools.
Thus, the overall turnover rate is currently
about 16%. Movers and leavers may leave their
schools or the teaching profession voluntarily or
involuntarily, and they may leave to retire or for
other preretirement reasons.
During 2012–13, when many schools were
being closed and many teachers were being
laid off during the Great Recession, there was a higher than usual rate of involuntary turnover, at
14%. (For context, less than 8% of turnover was involuntary in 2008–09.) Most of these teachers
attributed their involuntary moves to budget cuts, school closures, reduced student enrollment, and
school transfers. Almost all movers go on to regular teaching positions; the remaining few become
itinerant teachers who travel between school sites, long-term substitutes, or other nontraditional
teachers.
About 18% of total turnover (including movers and leavers) was due to retirement. Importantly,
more than two-thirds of all teacher turnover between the 2011–12 and 2012–13 school years
was voluntary, preretirement turnover (see Figure 2). The reasons for leaving a school can be
wide-ranging. One teacher might change schools, for example, because of unfavorable working
conditions, while another might leave to teach somewhere else as part of a family move.
In addition to the 8% of teachers
who leave the profession each
year, about 8% shift schools.
Thus, the overall turnover rate is
currently about 16%.
Figure 2
Involuntary
turnover, 14%
Retirement, 18%
Voluntary,
preretirement
leavers, 30%
Voluntary
movers, 37%
Stayers, 84% Turnover, 16%
67% of
turnover
Source: Learning Policy Institute analysis of National Center for Education Statistics Schools and Staffing Survey, 2011–12 and
Teacher Follow-Up Survey, 2012–13.
Sources of Teacher Turnover, 2011–12 to 2012–13
Where Do Teachers Who Leave the Profession Go?
Among those who left teaching entirely in 2012–13, about 38% retired (see Figure 3), but only
31% cited retirement as the major reason they left. Teachers who retired without claiming
retirement as a signicant reason might have taken an early-retirement package and gone on
to take another job or might have left for other reasons, but took retirement because they were
eligible. For example, a teacher may leave teaching because she moves to a new state and has
difculty transferring her teaching certication or pension plan to her new home state. If she

LEARNING POLICY INSTITUTE | TEACHER TURNOVER: WHY IT MATTERS AND WHAT WE CAN DO ABOUT IT 5
responds by retiring, she would be counted among retirees, despite not leaving with the intention to
retire. Others may have taken retirement because they were dissatised with teaching or in lieu of a
layoff or nonrenewal. About 12% of involuntary leavers went on to retire.
Aside from retirees, nearly 30% of leavers continued to work for a school or district outside of the
classroom, 9% left to take care of family members, and 8% took jobs outside of education. The
remaining leavers were unemployed, in college, disabled, working in education outside of k-12 or in
k-12 outside of a school or district, or working in some other unspecied occupation.
Teachers most often cite
dissatisfaction as a very important
reason for voluntarily leaving
the profession.
Figure 3
Retired
Working for a school or district, but not as a k-12 teacher
Caring for family members
Working outside of education
Unemployed
Other
Working in pre-K or postsecondary ed
College student
Disabled
Working in k-12 but not in a school or district
Note: Percentages do not add to 100 due to rounding.
Source: National Center for Education Statistics Teacher Follow-Up Survey, 2012–13.
Occupational Status of Leavers
PERCENT
0 5 10 15 20 25 30 35 40 45
Why Do Teachers Leave the
Profession?
According to their survey responses, teachers
most often cite dissatisfaction as a very
important reason for voluntarily leaving the
profession. (See Figure 4 for an overview and
Table 1 for disaggregated reports of each
reason category.) The most frequent area of
dissatisfaction cited by voluntary leavers in
2012–13 concerned testing and accountability
measures (25%), followed by unhappiness with the school administration (21%) and dissatisfaction
with the teaching career (21%), which likely has to do with many factors. Some of these teachers
may be among those who left to pursue another job (31%) and those who left for nancial reasons
(13%) as teachers could cite multiple reasons for leaving.
The next-largest group of leavers is made up of teachers who left for family or personal reasons that
include moving to a more conveniently located job, health reasons, and caring for family members.

LEARNING POLICY INSTITUTE | TEACHER TURNOVER: WHY IT MATTERS AND WHAT WE CAN DO ABOUT IT 6
Figure 4
Figure 5
0 10 20 30 40 50 60
Dissatisfaction
Family/personal reasons
Retirement
To pursue another job
Financial reasons
Note: Percentages do not add to 100 as teachers may select more than one reason for leaving.
Source: Learning Policy Institute analysis of National Center for Education Statistics Teacher Follow-up Survey, 2012–13.
Factors Teachers Report as Being Very Important for Leaving Teaching
PERCENT
55
43
31
31
18
Why Do Teachers Move Schools?
Voluntary movers also most commonly cite dissatisfaction as a very important reason for
voluntarily moving schools (see Figure 5). Among the two-thirds who leave for reasons of
dissatisfaction, the most frequent concerns are with school administration (33%), lack of inuence
on school decision making (29%), and school conditions, including facilities and resources (27%).
Financial reasons were separately cited by 27% of teachers.
0 10 20 30 40 50 60 70
Dissatisfaction
Family/personal reasons
To teach at another school
Financial reasons
Retirement benefits
Note: Percentages do not add to 100 as teachers may select more than one reason for moving.
Source: Learning Policy Institute analysis of National Center for Education Statistics Schools and Staffing Survey, 2012–13.
Factors Teachers Report as Being Very Important Reasons for Moving
PERCENT
66
52
48
27
4

LEARNING POLICY INSTITUTE | TEACHER TURNOVER: WHY IT MATTERS AND WHAT WE CAN DO ABOUT IT 7
Table 1
Family and personal reasons are also cited by 52% of movers as important reasons for leaving their
school; these reasons overlap with dissatisfactions, as respondents could choose more than one
response. These data do not provide more ne-grained responses that would distinguish between
teachers who leave for child-rearing purposes, to take care of an aging parent, to attend to their
own health issues, and so on.
The fact that 4% of movers cited retirement benets as a reason for leaving (although they did go
on to teach in another school) suggests that a small share of teachers are motivated to take these
benets when they are eligible and then nd another place to continue teaching.
While leaver and mover reports shed some light on reasons for turnover, they have a limited
capacity to denitively predict it, especially since the federal Teacher Follow-Up Survey cited here
asks only those who leave for their reasons in doing so. After all, teachers who choose to stay in
their classrooms and at their schools may experience many of the same challenges and frustrations
as those who decide to move or leave. In addition, the questions asked of movers and leavers do
not offer the opportunity for teachers to speak to the role of their preparation, or other key factors
associated with teacher turnover, in their decision making. We discuss these other reasons for
teacher attrition in a later section of this report.
Teacher Reasons for Leaving
Reasons Given for Leaving Overall Mathematics
& Science
Teachers
Special
Education
Teachers
ELD
Teachers*
Teachers of
Color
Teachers in
High-Poverty
Schools
Teachers in
High-Minority
Schools
Areas of Dissatisfaction
Dissatisfaction With Assessment and Accountability Issues
Dissatisfied because
of assessments and
accountability measures
25% 26 24 26 26 30 35
Dissatisfied because not
enough support to prepare
students for assessments
17% 18 14 4 18 24 25
Dissatisfied with
compensation tied to
student performance
8% 5 6 6 11 8 8
Dissatisfaction With Administrative Issues
Dissatisfied with the
administration
21% 13 14 6 22 18 15
Too many intrusions on
teaching time
18% 11 13 25 15 16 14
Discipline issues were an
issue at school
17% 10 10 26 19 18 17
Not enough autonomy in
the classroom
14% 7 6 12 15 12 10
Dissatisfied with lack of
influence over school
policies and practices
13% 10 8 4 14 12 9

LEARNING POLICY INSTITUTE | TEACHER TURNOVER: WHY IT MATTERS AND WHAT WE CAN DO ABOUT IT 8
Table 1: Teacher Reasons for Leaving (continued)
Reasons Given for Leaving Overall Mathematics
& Science
Teachers
Special
Education
Teachers
ELD
Teachers*
Teachers of
Color
Teachers in
High-Poverty
Schools
Teachers in
High-Minority
Schools
Dissatisfaction With Teaching Career
Dissatisfied with teaching
as a career
21% 12 15 12 19 18 16
Not enough opportunities
for leadership or
professional advancement
9% 7 7 2 9 6 5
Dissatisfaction With Working Conditions
Dissatisfied with job
description or assignment
12% 11 11 22 12 13 14
Dissatisfied with large class
sizes
10% 6 7 20 6 8 7
Dissatisfied with working
conditions (facilities,
classroom resources,
school safety)
9% 6 7 3 11 8 9
Personal or Life Reasons (43%)
Wanted to take a job more
conveniently located
11% 10 9 16 13 11 11
Other personal life reasons
(e.g., pregnancy/child care,
health, caring for family)
37% 33 42 42 40 37 41
Change of Career (31%)
Decided to pursue another
career
28% 22 23 31 29 25 24
Taking courses to improve
career opportunities within
the field of education
13% 9 13 3 19 11 10
Taking courses to improve
career opportunities
outside the field of
education
5% 5 4 0 5 3 3
Retirement (31%)
Decided to retire or receive
retirement benefits
31% 28 37 50 27 29 22
Financial Reasons ( 18%)
Wanted or needed a higher
salary
13% 11 16 3 11 1 9
Needed better benefits
8% 5 8 0 6 5 3
Concerned about job
security
7% 6 7 1 6 6 4
* The sample of ELD teachers is small. Interpret with caution.
Sources: National Center for Education Statistics Schools and Staffing Survey, 2011–12, and Teacher Follow-Up Survey,
2012–13.

LEARNING POLICY INSTITUTE | TEACHER TURNOVER: WHY IT MATTERS AND WHAT WE CAN DO ABOUT IT 9
Regional and State-by-State Trends
There is wide variation among states and
regions in teaching conditions—such as salaries
offered, certication requirements, working
conditions, per-pupil spending, and a host
of other factors—that affect teachers and
students. For example, at the high end of the
spectrum, Wyoming teachers had higher than
average starting salaries of over $43,000 in
2013, and teachers on average earned 94% of
what other comparably educated professionals
in the state earned at the same age, education
level, and hours worked.
11
On the other end,
Arizona teachers had lower beginning salaries at just $31,874 and earned only 62% of what other
professionals in the state did at the same age, education level, and hours worked.
These estimates may actually overstate the comparability of teacher salaries with those of other
workers because studies nd that teachers often work considerably longer hours than required by
their contracts and do substantial work in the summer to prepare for the next school year.
12
Aside from the unique status of Wyoming, which has had signicant oil revenues in recent
years, salaries are typically highest in the Northeast and lowest in the South and West. Teaching
conditions also vary dramatically across regions. In the West, pupil-teacher ratios are especially
high, ranging between 18-to-1 and 24-to-1 in Colorado, Washington, Idaho, Nevada, Oregon,
Arizona, Utah, and California, from least to greatest. In the Northeast, pupil-teacher ratios are
much smaller, ranging from just 11-to-1 in Vermont to a high of 15-to-1 in Rhode Island.
13
(Note
that class sizes are always larger than pupil-teacher ratios, since teachers have other non-teaching
duties and time during the day.)
At 16.7% annually, the South has a particularly high turnover rate compared to the northeastern,
midwestern, and western regions, which average, at most, 13% annual turnover. Southern and
midwestern cities have the highest rates of teacher turnover, followed by southern suburbs, towns,
and rural areas (see Figure 6). The higher-spending Northeast averages the lowest turnover rates
across all district types, with about 10% turnover overall and less than 8% turnover in its towns and
rural areas. For most regions, turnover is higher in cities than in any other district type. By contrast,
in the West, turnover in cities and suburbs is lower than turnover in towns and rural areas.
At 16.7% annually, the South has
a particularly high turnover rate.
The higher-spending Northeast
averages the lowest turnover
rates, with about 10% turnover
overall.

LEARNING POLICY INSTITUTE | TEACHER TURNOVER: WHY IT MATTERS AND WHAT WE CAN DO ABOUT IT 10
0%
2%
4%
6%
8%
10%
12%
14%
16%
18%
20%
Northeast
Midwest
South
West
Northeast
Midwest
South
West
Northeast
Midwest
South
West
Northeast
Midwest
South
West
Northeast
Midwest
South
West
Turnover Rates Vary by Region and District Type
Note: District types are based on 2000 Census population and geography information. For more information, see
Documentation to the NCES Common Core of Data Public Elementary/Secondary School Universe Survey: School
Year 2009–10 (NCES 2008–332).
Source: Learning Policy Institute analysis of National Center for Education Statistics Schools and Staffing Survey 2011–12,
and Teacher Follow-Up Survey 2012–13.
TURNOVER RATE
CITYOVERALL SUBURB TOWN RURAL
10.3%
12.0%
16.7%
12.1%
16.4%
17.3%
12.5%
9.2%
12.2%
15.8%
9.6%
7.7%
12.1%
14.3%
12.6%
6.8%
9.6%
14.7%
13.3%
11.0%
Figure 6
The variation in annual turnover is even greater
between states, ranging from just over 8% in
Utah to 24% in Arizona (see Figure 7). In almost
every state, the bulk of turnover is due to
preretirement leaving and moving. Retirement
represents less than a third of all turnover in
every state except for Oregon and New Jersey,
where retirement accounts for 37% and 44% of
turnover, respectively. In 30 states, retirement
turnover is 25% or less of all turnover.
In almost every state, the bulk of
turnover is due to preretirement
leaving and moving. Retirement
represents less than a third of all
turnover in every state except for
Oregon and New Jersey.

LEARNING POLICY INSTITUTE | TEACHER TURNOVER: WHY IT MATTERS AND WHAT WE CAN DO ABOUT IT 11
Figure 7
0%
5%
10%
15%
20%
25%
Note: States with fewer than 25 teachers surveyed were excluded (DC, HI, and WY). Three small New England states with
similar data patterns were combined (NH, RI, VT).
Source: Learning Policy Institute analysis of National Center for Education Statistics Schools and Staffing Survey, 2011–12 and
Teacher Follow-up Survey, 2012–13.
Teacher Turnover Varies Widely by State
■ Retirement Leavers ■ Preretirement Leavers ■ Movers
TURNOVER RATE
AZ
NM
LA
TX
NV
MT
OK
MS
NC
DE
SC
AK
WI
MN
KY
IN
KS
CO
ND
VA
FL
MO
AL
AR
IA
MA
ID
TN
OH
GA
MI
SD
MD
OR
NY
CT
CA
NE
ME
WA
IL
PA
NJ
New England
WV
UT
Subject-Area Turnover
In recent years, there have been severe shortages of teachers qualied to teach mathematics,
science, special education, and English language development in schools across the country. High
teacher turnover rates can intensify these shortages, especially in hard-to-staff schools with few
resources to attract teachers from a limited pool of qualied teachers. As discussed below, research
suggests that the causes of these shortages differ among subject areas.
Turnover rates vary across subject areas, with the
lowest rates found among general elementary
teachers and humanities teachers. Mathematics,
science, and special education teachers have
higher turnover rates, exceeding 13% annually.
Teachers who primarily teach English to speakers
of other languages have an even higher turnover
rate of about 19%; this rate is driven especially
by movers
14
(see Figure 8).
Turnover rates vary across subject
areas, with the lowest rates found
among general elementary and
humanities teachers.

LEARNING POLICY INSTITUTE | TEACHER TURNOVER: WHY IT MATTERS AND WHAT WE CAN DO ABOUT IT 12
Figure 8
Mathematics and science
American students have demonstrated declining achievement in mathematics and science, subjects
that are increasingly important in an economy driven by technological innovation.
15
According to
the most recent Program for International Student Assessment (PISA) results from 2015, the United
States scores well below average in mathematics, ranking 31st out of 35 Organisation for Economic
Co-operation and Development (OECD) countries. The U.S. ranks 19th in science, with average
scores among this group.
16
U.S. performance on these international tests has dropped in these
subjects plus reading since 2000, when PISA was rst administered.
17
A well-prepared mathematics and science teacher workforce can support student achievement;
however, secondary mathematics and science positions have been historically difcult to ll.
18
Indeed, one recent national study showed that schools were about four times more likely to have
trouble lling mathematics and science positions than English positions. Compared to schools
not reporting these difculties, schools that reported difculties lling mathematics and science
positions were nearly twice as likely to have above-average teacher turnover rates the year before
having the vacancy.
19
When schools have trouble lling positions, they often rely on hiring
unqualied and inexperienced teachers, which undermines student achievement and contributes to
ongoing turnover.
20
There are two primary arguments for why mathematics and science teachers have higher turnover
rates than teachers in other subject areas: (1) opportunities for better-compensated positions
in other occupations as well as in other school districts, and (2) lack of teacher preparation. The
literature on mathematics and science teacher turnover offers evidence that these teachers leave
teaching because their skills give them access to higher-paying jobs.
21
In addition, scholars have
found that mathematics and science teachers often tend to have less teacher preparation than
teachers of other subjects—in part because many enter through alternative pathways, which are
associated with higher attrition rates.
22
0% 2% 4% 6% 8% 10% 12% 14% 16% 18% 20%
General elementary
Humanities
Mathematics/science
Special education
English language
development
Source: Learning Policy Institute analysis of National Center for Education Statistics Schools and Staffing Survey, 2011–12.
Turnover Rates Vary by Primary Teaching Assignment
TURNOVER RATE
■ Leavers ■ Movers
4.9% 6.4%
5.3%7.3 %
6.1%7.2%
8.6%5.6%
6.9% 12%

LEARNING POLICY INSTITUTE | TEACHER TURNOVER: WHY IT MATTERS AND WHAT WE CAN DO ABOUT IT 13
Differences in attrition rates for mathematics and science teachers in comparison to teachers
in other subject areas are not statistically signicant overall; however, mathematics and science
teachers leave Title I schools at a signicantly higher rate than they leave non-Title I schools. In
Title I schools, the turnover rate for mathematics and science teachers is nearly 70% greater than it
is in non-Title I schools (17.8% versus 10.5%).
Additionally, in schools serving low-income students and students of color, mathematics and
science teachers are also more likely to have been certied via an alternative pathway. While the
characteristics of alternative certication pathways vary, these accelerated programs often require
fewer courses and less clinical experience than traditional programs do before participants become
teachers. In schools with the most students of color, fully 30% of mathematics and science teachers
entered teaching via an alternative pathway, compared to just 12% of mathematics and science
teachers at schools with mostly White students. Teachers who enter through such pathways often
lack the experience of student teaching and may also lack critical coursework in subject-specic
teaching methods and curricula that can undermine their initial teaching experiences.
Special education
Since federal law was passed in 1975 to ensure all students have access to a free and appropriate
education, the proportion of students who receive special education services has steadily grown.
23
When the Individuals With Disabilities Education Act (IDEA) went into effect, 8.3% of public school
children, ages 3 to 21, were served by the law. In 2012–13, that percentage rose to nearly 13%, a
55% increase over nearly 40 years. Schools need special education teachers who can meet the needs
of a variety of students, including those with autism, developmental delays, learning disabilities,
health impairments, and other disabilities.
24
Teacher shortages in special education have been severe and persistent. In every year of the 1990s,
more than 30,000 special education positions were lled by uncertied teachers, and in 2000–01,
over 47,000 (or 11%) of those lling special education positions were not certied to teach in
the subject area.
25
A recent study of teacher shortages found that, in 2015–16, 48 states plus the
District of Columbia reported special education teacher shortages, with these being the most severe
shortages for most states.
26
According to past research, two primary factors
drive special education teacher shortages: (1)
too few special education teachers are being
prepared, and (2) too many leave each year.
Importantly, difcult working conditions—such
as lack of administrative support, lack of
collaboration, and excessive paperwork—play
a key role in teacher decisions to leave the
profession or transfer from special education to
general education positions.
27
As illustrated in Figure 8, special education teacher turnover rates are greater than those of most
other categories of teachers. Special education teachers have about the same turnover rates in Title
I schools as they do in non-Title I schools. However, in high-minority schools, their turnover rates
In Title I schools, the turnover
rate for mathematics and science
teachers is 70% greater than it is
in non-Title I schools.

LEARNING POLICY INSTITUTE | TEACHER TURNOVER: WHY IT MATTERS AND WHAT WE CAN DO ABOUT IT 14
are considerably higher than turnover rates in low-minority schools (19.9% versus 10.8%). Special
education teachers in high-minority schools are also 3.5 times more likely to be alternatively
certied than special education teachers in low-minority schools (24.7% versus 6.9%).
Special education teachers are more likely to state that they left teaching due to retirement or for
nancial reasons, compared to average leaver reports (Table 1).
Turnover in Schools Serving Historically Underserved Students
Research has long found that schools with larger
low-income and student-of-color populations
experience greater rates of teacher turnover
than schools on average.
28
Thus, in schools
serving predominantly low-income students and
students of color, students are often subjected to
a “revolving door” of less-experienced teachers.
29
Previous research suggests many conditions
contribute to these high turnover rates. Among
them, schools with primarily low-income
students and students of color are staffed by newer teachers and teachers with less preparation,
report having inferior teaching supports and working conditions, and are more deeply impacted by
accountability measures.
30
Many of these factors have previously been found to inuence teacher attrition. For example, teachers
who lack comprehensive preparation are 2 to 3 times more likely to leave teaching in their early years
than those who are fully prepared.
31
Similarly, teachers who receive less mentoring and induction
support are more likely to leave,
32
as are those who experience less desirable working conditions.
33
Schools serving vulnerable populations have the additional responsibility of responding to
community concerns, such as food insecurity, environmental pollution, and access to adequate
health care and housing. While improving teacher turnover rates may not be wholly sufcient to
address every one of these needs, increasing student access to high-quality teachers by reducing
teacher turnover is a critical effort.
Title I schools
Title I schools are those with high percentages of low-income students that receive federal funds
under Title I of the Elementary and Secondary Education Act to help students meet academic
standards. The turnover rate in Title I schools is nearly 50% greater than that in non-Title I schools
(16% versus 11%) (see Figure 9). Mathematics and science teacher turnover rates are nearly 70%
greater in Title I schools than in non-Title I schools, and alternative certication teacher turnover is
more than 80% higher. While turnover rates for teachers with 3 or fewer years of experience are high
for teachers in all schools (with no statistically signicant difference between those in Title I and
non-Title 1 schools), teachers with more experience have turnover rates nearly 80% higher in Title I
schools than in non-Title I schools.
In schools with predominantly
low-income students and students
of color, students are often
subjected to a “revolving door” of
less-experienced teachers.

LEARNING POLICY INSTITUTE | TEACHER TURNOVER: WHY IT MATTERS AND WHAT WE CAN DO ABOUT IT 15
Teachers in Title I schools have spent about 2
years less at their current school and have a year
less of overall teaching experience than teachers
in non-Title I schools (see Figures 10 and 11).
In most of the major subject areas, teachers in
Title I schools have spent about 2 years fewer
at their current school than those teachers in
non-Title I schools. Teachers certied through
a regular pathway have the greatest longevity
at their current Title I school (9 years), while
alternatively certied teachers spend the least
time (6 years) teaching at their current Title I
school (see Figure 10).
Teachers in Title I schools have
spent about 2 years less at their
current school and had a year less
of overall teaching experience
than teachers in non-Title I
schools.
Figure 9
0%
5%
10%
15% 20% 25% 30%
All teachers***
Humanities teachers***
Mathematics and science teachers***
Special education teachers
ELD teachers
Regular certification pathway***
Alternative certification pathway***
4 or more years experience***
3 or fewer years of experience
Teacher Turnover Is Greater in Title I Schools
11%
16%
10%
16%
18%
16%
17%
16%
20%
11%
16%
11%
28%
22%
20%
9%
16%
11%
Note: Percentages are rounded to the nearest whole number; *** p<0.01, ** p<0.05, * p<0.1
Source: Learning Policy Institute analysis of National Center for Education Statistics Schools and Staffing Survey, 2011–12 and
Teacher Follow-Up Survey, 2012–13.
TURNOVER RATE
■ Non Title I Schools ■ Title I Schools

LEARNING POLICY INSTITUTE | TEACHER TURNOVER: WHY IT MATTERS AND WHAT WE CAN DO ABOUT IT 16
Figure 10
0 2 4 6 8 10 12
All teachers***
Humanities teachers***
Mathematics and science teachers***
Special education teachers***
Alternative certification**
Regular certification***
Teachers in Title I Schools Stay Fewer Years
10
8
11
8
8
9
7
7
6
11
9
10
Note: *** p<0.01, ** p<0.05, * p<0.1
Source: Learning Policy Institute analysis of National Center for Education Statistics Schools and Staffing Survey, 2011–12.
YEARS AT CURRENT SCHOOL
■ Non-Title I School ■ Title I School
For the most part, differences in years of teaching experience are slight between teachers in Title I
schools and non-Title I schools. Mathematics and science teachers, however, have 2 fewer years of
experience in Title 1 schools.
Figure 11
0 2 4 6 8 10 12 14 16
All teachers***
Humanities teachers***
Mathematics and science teachers***
Special education teachers
Alternative certification pathway**
Regular certification pathway**
Teachers in Title I Schools Have Fewer Years of Experience
14
13
15
14
12
13
12
10
8
15
14
14
Note: *** p<0.01, ** p<0.05, * p<0.1
Source: Learning Policy Institute analysis of National Center for Education Statistics Schools and Staffing Survey, 2011–12.
YEARS OF EXPERIENCE
■ Non-Title I Schools ■ Title I Schools

LEARNING POLICY INSTITUTE | TEACHER TURNOVER: WHY IT MATTERS AND WHAT WE CAN DO ABOUT IT 17
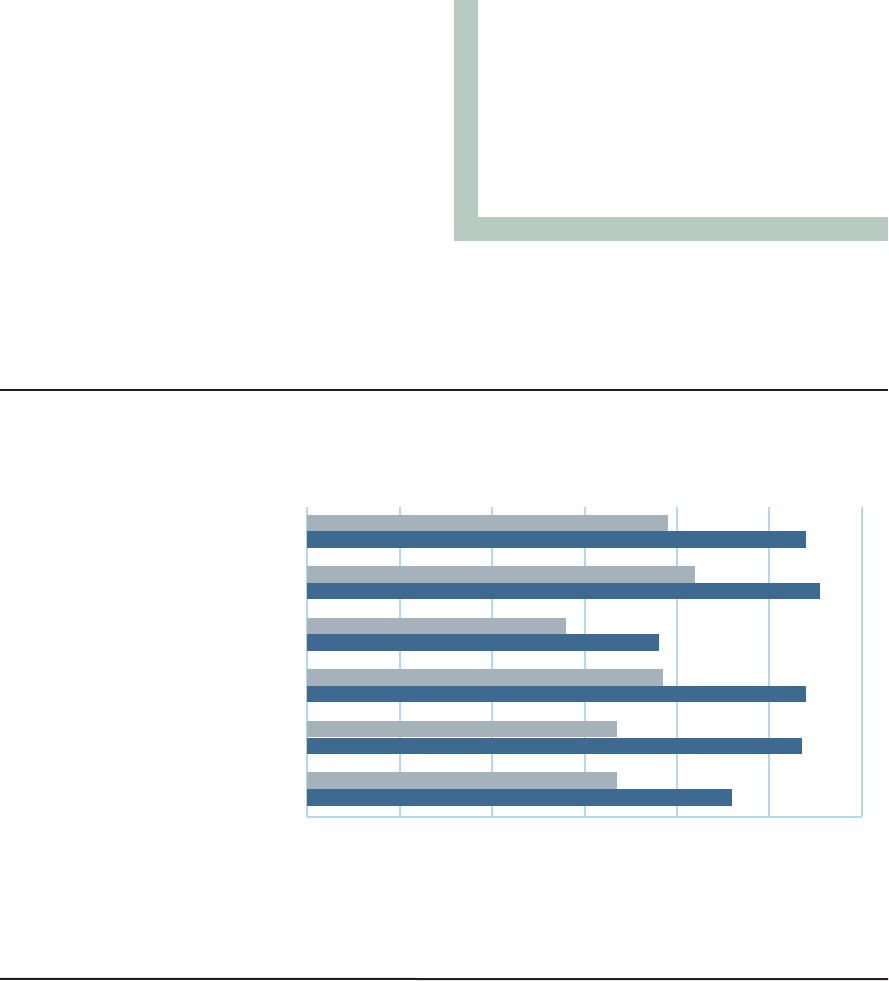
Figure 12
Compared to the average teacher, teachers in schools serving students of color and students
in poverty were more likely to report that, in their decision to leave teaching, testing and
accountability measures and administrative support were very important reasons. They were less
likely to state that retirement and nancial reasons were as important.
Schools serving students of color
In the quartile of schools with the most students of color (more than 55%), the turnover rate is
about 70% greater than that in the quartile of schools with the fewest students of color (less than
10%). Across the board, turnover rates in high-minority schools are higher—regardless of teachers’
subject taught, years of experience, or certication pathway (see Figure 12). Mathematics and
science teacher turnover rates are 90% higher in the top quartile of schools than in the bottom.
Special education teachers are more than 80% more likely to turn over, and teachers certied via
an alternative pathway are 150% more likely to leave in schools with the greatest concentration
of students of color than in those with the lowest. English language development teachers and
teachers with 3 or fewer years of experience have high turnover rates in both high-minority and
low-minority schools. Nearly one in four inexperienced teachers leave high-minority schools in a
given year.
0%
5%
10% 15% 20% 25% 30%
All teachers***
Humanities teachers
Mathematics and science teachers***
Special education teachers**
ELD teachers
Regular certification pathway***
Alternative certification pathway***
4 or more years’ experience***
3 or fewer years’ experience
Teacher Turnover Is Greater When Schools Serve Primarily Students of Color
17%
10%
16%
12%
10%
20%
11%
21%
22%
16%
10%
20%
24%
18%
8%
16%
9%
19%
Note: Percentages are rounded to the nearest whole number; *** p<0.01, ** p<0.05, * p<0.1
Source: Learning Policy Institute analysis of National Center for Education Statistics Schools and Staffing Survey, 2011–12 and
Teacher Follow-Up Survey, 2012–13.
TURNOVER RATE
■ Top Quartile Students of Color (55% or Greater)
■ Bottom Quartile Students of Color (Fewer Than 10%)
LEARNING POLICY INSTITUTE | TEACHER TURNOVER: WHY IT MATTERS AND WHAT WE CAN DO ABOUT IT 18
Consistent with the literature, teachers in high-
minority schools tend to have less experience
overall and, according to our analysis, have spent
less time teaching at their current school. In
schools with predominantly White students, the
average teacher has been teaching at the same
school for 11 years and has 15 years of teaching
experience. At schools with predominantly
students of color enrolled, the average teacher
has been teaching at the same school for 8 years
and has about 12 years of experience (see Figures 13 and 14). This differential is even greater for
mathematics and science teachers who have been at their current school for 4 years fewer if they are
in the top quartile of schools serving students of color (see Figure 13).
Figure 13
0
2 4 6
8 10 12
All teachers***
Regular certification pathway***
Alternative certification pathway***
Humanities teachers***
Mathematics and science teachers***
Special education teachers***
Teachers in Schools Serving Primarily Students of Color
Stay Fewer Years
8
11
8
11
8
8
11
7
11
7
9
6
Note: *** p<0.01, ** p<0.05, * p<0.1
Source: Learning Policy Institute analysis of National Center for Education Statistics Schools and Staffing Survey, 2011–12.
YEARS AT CURRENT SCHOOL
■ Top Quartile Students of Color (55% or Greater)
■ Bottom Quartile Students of Color (Fewer Than 10%)
Of all teachers, those certified
through a regular pathway average
the greatest amount of teaching
experience overall, as well as at
their current placement.

LEARNING POLICY INSTITUTE | TEACHER TURNOVER: WHY IT MATTERS AND WHAT WE CAN DO ABOUT IT 19
Figure 14
0 2 4 6
8 10 12 14 16
All teachers***
Regular certification pathway***
Alternative certification pathway***
Humanities teachers***
Mathematics and science teachers***
Special education teachers
Teachers in Schools Serving Primarily Students of Color Have Less
Overall Experience
13
15
14
15
10
13
15
11
15
12
13
9
Note: *** p<0.01, ** p<0.05, * p<0.1
Source: Learning Policy Institute analysis of National Center for Education Statistics Schools and Staffing Survey, 2011–12.
YEARS OF EXPERIENCE
■ Top Quartile Students of Color (55% or greater)
■ Bottom Quartile Students of Color (Fewer Than 10%)
Of all teachers, those certied through a regular pathway average the greatest amount of
teaching experience overall and time at their current placement, whether at schools with
predominantly students of color or with predominantly White students, while alternatively
certied teachers average the least amount of teaching experience and fewest years teaching in
their current placement. Alternatively certied teachers spend about 3 years fewer at schools
with predominantly students of color than regularly certied teachers and have 5 fewer years of
experience overall. More than half of all alternative certication teachers teach in schools with
the greatest concentrations of students of color and account for 21% of teachers in these schools.
In contrast, alternative certication teachers account for less than 9% of teachers in schools with
predominantly White students. Thus, schools with predominantly students of color are most
likely to have teachers with the fewest years of teaching experience, the fewest years at their
school site, and the highest turnover rates at their schools.
Controlling for all other variables, teachers at schools with the greatest proportion of students
of color move schools or leave teaching at a rate 50% higher than teachers in schools with the
fewest students of color (p < 0.05). However, as other studies show, the predictive relationship
between student race and teacher turnover is reduced when working conditions are included as
well, suggesting that these conditions explain at least some of the high rates of teacher turnover in
high-minority schools.
34

LEARNING POLICY INSTITUTE | TEACHER TURNOVER: WHY IT MATTERS AND WHAT WE CAN DO ABOUT IT 20
Turnover of Teachers of Color
Students of color comprised 49% of public
school students nationally in 2012 and are
projected to be in the majority by the year 2024.
Teachers of color made up just 18% of the public
school teacher workforce in 2012. Although
that proportion has been steadily growing,
the numbers are still much smaller than the
demand from employers and families.
35
Previous
research demonstrates that teacher diversity
has several important outcomes for students of
color: Teachers of color appear to improve the
schooling experiences and academic outcomes
of students of color, and they are more likely to
feel called to teaching positions in low-income
communities of color where openings are difcult to ll.
36
Several studies also suggest that all
students benet from having teachers of color because they bring distinctive knowledge and
experiences, and function as role models to the student body as a whole.
37
Despite successful recruitment of teachers of color in recent years, high turnover rates continue to
contribute to shortages of teachers of color.
38
A key step to increasing the proportion of teachers of
color in the teacher workforce is addressing the particular factors that contribute to their decisions
to move schools and leave teaching.
With 3 in 4 teachers of color working in the quarter of schools with the most students of color, their
turnover decisions have important implications, especially for students of color, who have been
found to perform better in school when they have teachers of color.
39
While the overall teacher
mover rate has remained fairly steady, that is not so for teachers of color, who have experienced a
mover rate that has ranged from 6% to 10% since 1988. Teachers of color and White teachers have
left the workforce at similar rates over time (see Figure 15) but have moved schools at signicantly
different rates (see Figure 16).
Teachers of color are also more likely to enter teaching through an alternative pathway.
A quarter of teachers of color did so, double the share for White teachers. While there is a
statistically signicant difference in the overall turnover rates of teachers of color and White
teachers (18.9% and 15.1%, respectively), this does not hold true across school types. When
teachers of color and White teachers work in schools with the same proportion of students of color,
their turnover rates are statistically indistinguishable. This analysis shows that teachers of color are
simply more likely to teach in schools where turnover rates are higher for all teachers.
Teachers of color appear to
improve the schooling experiences
and academic outcomes of
students of color, and they are
more likely to feel called to
teaching positions in low-income
communities of color where
openings are difficult to fill.

LEARNING POLICY INSTITUTE | TEACHER TURNOVER: WHY IT MATTERS AND WHAT WE CAN DO ABOUT IT 21
0%
2%
4%
6%
8%
10%
12%
Source: Learning Policy Institute analysis of National Center
for Education Statistics Schools and Staffing Survey,
2011–12 and Teacher Follow-up Survey, 2012–13.
Teacher Leaving Rates,
1988–89 to 2012–13
1985 1990 1995 2000 2005 2010 2015
■ Teachers of Color ■ White Teachers
YEARS
0%
2%
4%
6%
8%
10%
12%
Source: Learning Policy Institute analysis of National Center
for Education Statistics Schools and Staffing Survey,
2011–12 and Teacher Follow-up Survey, 2012–13.
Teacher Moving Rates,
1988–89 to 2012–13
1985 1990 1995 2000 2005 2010 2015
■ Teachers of Color ■ White Teachers
YEARS
Figure 15 Figure 16

LEARNING POLICY INSTITUTE | TEACHER TURNOVER: WHY IT MATTERS AND WHAT WE CAN DO ABOUT IT 22
Teachers overall
Black teachers
Non-Black teachers
0%
5% 10% 15% 20% 25%
Source: Learning Policy Institute analysis of National Center for Education Statistics Schools and Staffing Survey, 2011–12
and Teacher Follow-Up Survey, 2012–13.
Teacher Leaver and Mover Rates, 2012
TURNOVER RATE
■ Leavers Rate ■ Movers Rate
8.1%
11.7%
7.8 %
7.7%
10.1%
7.5 %
Figure 17
The Special Case of Black Teacher Turnover
Historically, Black teachers have played a central role in American schools. Being largely responsible
for the education of Black children from Reconstruction to the era of school integration—about 100
years—Black teachers have been community leaders and have helped to build the Black middle
class.
40
In more recent years, Black teachers have comprised a perpetually small share of the teacher
workforce. While the Black teacher workforce has grown from 191,000 teachers in 1987–88 to
231,000 in 2011–12, the proportion of Black teachers decreased from 8.2% to 6.8% of the teacher
workforce during the same period. Meanwhile, Black students comprised nearly 16% of the public
school student population in 2013.
Across a range of studies, Black teachers have been associated with lower dropout rates, improved
student achievement, increased student interest in college, and positive perceptions from students.
41
Additionally, Black teachers are more likely to feel called to teaching in low-income communities
of color where openings are difficult to fill. Nearly 80% of Black teachers work in schools in the top
quartile of students of color, and more than 70% teach in Title I schools.
Although Black teachers were once more likely to stay in teaching than White teachers, Black teacher
turnover rates are now extremely high. At about 22%, the Black teacher turnover rate is nearly 50%
greater than the non-Black teacher turnover rate (see Figure 17). In the South, where Black teachers
are most likely to teach, their annual turnover rates are 26%.
Considering the important role Black teachers play in the workforce and their diminishing position in it,
it is essential to identify ways to reduce their attrition from the workforce.
Reasons for Black teacher turnover
Black teachers have about the same average age and teaching experience as other teachers, but Black
teachers in their first year in 2012 were 3.5 times more likely to have no student teaching experience
than all other first-year teachers (28.2% versus 7.9%), a discrepancy driven by disproportionate entry
through alternative certification routes. Nearly half of newly hired Black teachers were certified through
an alternative pathway, compared to just 22% of all other first-year teachers.

LEARNING POLICY INSTITUTE | TEACHER TURNOVER: WHY IT MATTERS AND WHAT WE CAN DO ABOUT IT 23
In 2012, in an era of school closings and layoffs in many cities, the rate of involuntary turnover was
much higher for Black teachers than for all other teachers, constituting nearly a third of all turnover.
Twelve percent of Black teachers who left the profession did so involuntarily, while 10% of teachers
on average did.
42
While about 30% of all movers left their schools involuntarily,
43
over 50% of Black
teachers moved involuntarily.
This has been substantially a function of teacher layoffs during the recession and school closings
in urban districts due both to declining enrollments and sanctions targeted to schools with low
test scores under No Child Left Behind.
44
Decreases in the numbers of Black teachers have been
proportionally much greater than decreases in the size of the overall teaching force in some of the
nation’s largest cities, listed in Table 2. In New Orleans, more than 7,000 teachers—most of whom were
Black—were fired en masse after Hurricane Katrina. They were replaced by predominantly young, White
teachers brought in to teach in the charter schools that replaced the district schools. As a result, the
number of Black teachers declined there by more than 62%. In other major cities, the number of Black
teachers has declined by anywhere from 15% to 39%.
Table 2
Change in Proportion of Teachers in Selected Cities by Teacher Race,
2000–12
City Overall White Black Hispanic
Boston -3.3 -0.8 -18.3 1.1
Chicago -13.4 -3.2 -39.2 6.4
Cleveland -17.4 -12.0 -33.9 -9.4
Los Angeles -16.9 -28.0 -33.2 6.5
New Orleans -44.4 3.3 -62.3 43.5
New York City -2.0 -1.9 -15.1 2.4
San Francisco -11.9 -21.9 -32.4 8.1
Source: Albert Shanker Institute
Among voluntary leavers, Black teachers in 2012–13 were much less likely to say they left for personal
or family reasons, or to find a school in a more convenient location, and much more likely to express
dissatisfaction with their salary, lack of resources, worries about job security due to accountability
measures, lack of classroom autonomy, and lack of collegial support. Nearly twice as many Black
teachers as non-Black teachers strongly disagreed that the materials they need to teach were readily
available to them (e.g., textbooks, supplies, copy machines, etc.).
There is hope to be found in the fact that Black teachers tended to cite specific issues with respect to
their teaching conditions as reasons for leaving. These can be addressed by policy interventions, which
can be a tool for increasing Black teacher retention.

LEARNING POLICY INSTITUTE | TEACHER TURNOVER: WHY IT MATTERS AND WHAT WE CAN DO ABOUT IT 24
Predictors of Turnover
The descriptive data presented above illustrate patterns of attrition; however, they do not control
for various inuences that might be associated with these trends. There are a number of factors
that have been found to impact teachers’ decisions to stay in their classrooms, move schools, or
leave teaching altogether, including compensation, student characteristics, teacher preparation and
mentoring, age and experience, and working conditions.
In order to learn how each of these contribute to decisions to move or leave, we calculated teachers’
predicted probabilities of leaving their school from a logistic regression model that controls, rst,
for a variety of school characteristics, then for teacher characteristics, main teaching subject area,
and, nally, workplace conditions (see Technical Appendix, page 35).
School Characteristics
Some previous research has suggested that
teachers have a preference for teaching in
schools with wealthier, higher-performing, and
greater proportions of White students.
45
Other
research, however, emphasizes the desire of
many teachers to work with vulnerable student
populations and illustrates how a host of factors,
including teacher preparation and workplace
conditions, make that difcult to sustain.
46
Consistent with previous research, we found
that, controlling for school size and student
poverty rates, those teaching in schools with
25% or more students of color were more likely to move or leave teaching than teachers in schools
with fewer students of color, all else being equal (see Figure 18). Student characteristics, such
as eligibility for free or reduced-price lunch, were not signicantly related to turnover, but it is
of interest to note that they became somewhat less predictive of teacher turnover when other
variables, such as working conditions, were also included in the model. We recognize that there may
be other unobserved variables, such as working conditions that are not accounted for in our model,
given the limitations of our data. Some of these factors may be related to both the proportion of
low-income students and students of color in a school and high rates of teacher turnover.
Teacher turnover rates were negatively correlated with school size, but not with urbanicity variables
or school level. Turnover rates were positively correlated with class size but the correlation was not
statistically signicant
We found that those teaching
in schools with 25% or more
students of color were more likely
to move or leave teaching than
teachers in schools with fewer
students of color, all else being
equal.

LEARNING POLICY INSTITUTE | TEACHER TURNOVER: WHY IT MATTERS AND WHAT WE CAN DO ABOUT IT 25
Figure 18
0%
2%
4%
6%
8%
10%
12%
14%
16%
Note: Brackets represent 95% confidence interval of the estimate.
Source: Learning Policy Institute analysis of National Center for Education Statistics Schools and Staffing Survey, 2011–12
and Teacher Follow-up Survey, 2012–13.
Predicted Turnover Rate by Population of Students of Color
PREDICTED TURNOVER RATE
Less than 10% 10-24% 25-54% Greater than 55%
PERCENTAGE OF STUDENTS OF COLOR
9.1%
10.3%
12.9%
13.3%
Those who entered the profession
through an alternative certification
program were 25% more likely
to leave their schools than were
full-time teachers who entered
teaching through a regular
certification program, holding all
else constant.
Teacher Characteristics
As expected, teacher age was related to leaving rates, with the youngest and oldest categories
of teachers having higher rates than those who were mid-career. After controlling for age,
experience levels did not have an effect on turnover. With controls for other student and teacher
characteristics, teachers’ race did not inuence turnover.
However, we found that teachers’ preparation
pathway did inuence turnover. Those who
entered the profession through an alternative
certication program were 25% more likely
to leave their schools than were full-time
teachers who entered teaching through a regular
certication program, holding all else constant.
About 15% of all teachers surveyed in 2011–12
and about 1 in 4 rst-year teachers surveyed
had entered teaching through an alternative
pathway, which typically requires that a teacher
work toward the requirements of a full credential
while teaching and receiving little formal
training beforehand.
47
Disparities in turnover
rates were slightly greater in schools with predominantly students of color. Alternative pathway
teachers left their schools at rates about 28% greater than regular certication teachers when in
high-minority schools (see Figure 19).

LEARNING POLICY INSTITUTE | TEACHER TURNOVER: WHY IT MATTERS AND WHAT WE CAN DO ABOUT IT 26
These ndings are not surprising. Studies of the relationship between teacher preparation and
teacher turnover suggest teachers with the least preparation are 2 to 3 times more likely to leave
the profession than those with the most comprehensive preparation—including student teaching
and courses in teaching methods.
48
In our sample, consistent with the literature, teachers who were
alternatively certied received less preservice preparation. Based on analysis of the data, alternative
pathway teachers were less likely to have student taught before teaching, and those who did were
less likely to have taught more than a few weeks. Traditional pathway teachers were more likely to
report having taken 10 or more courses in teaching methods, and they were more likely to report
feeling well prepared or very well prepared to handle a variety of teaching responsibilities in their
rst year, including classroom management, choosing instructional materials, and using assessment
to inform instruction.
Quite often, teachers choose alternative
certication pathways because, without nancial
aid, they cannot afford to be without an income
for the time it takes to undergo teacher training.
Furthermore, candidates are less likely to be
willing to go into debt for training if the nancial
rewards of the occupation are lower.
49
Those
states and districts that offer fewer inducements
to teaching are most likely to rely on teachers
Figure 19
0%
5%
10%
15%
20%
25%
Predicted Turnover Rate by Population of Students of Color and
Teacher Preparation Pathway
Note: Brackets represent 95% confidence interval of the estimate.
Source: Learning Policy Institute analysis of National Center for Education Statistics Schools and Staffing Survey, 2011–12
and Teacher Follow-Up Survey, 2012–13.
PREDICTED TURNOVER RATE
Less than 10% 10–24% 25–54% Greater than 55%
■ Traditional Pathway ■ Alternative Pathway
PERCENTAGE STUDENTS OF COLOR
8.8%
11.4%
12.8%
16.0%
16.4%
12.8%
9.9%
12.4%
Quite often, teachers choose
alternative certification pathways
because, without financial aid,
they cannot afford to be without
an income for the time it takes to
undergo teacher training.

LEARNING POLICY INSTITUTE | TEACHER TURNOVER: WHY IT MATTERS AND WHAT WE CAN DO ABOUT IT 27
Figure 20
who are not yet fully trained. Thus, it is not surprising that alternatively certied teachers were
more likely to teach in states where wages were less comparable to wages for other professionals
with graduate degrees and in districts with lower than average maximum salaries.
Main Teaching Subject Area
With the addition of main teaching subject in our third model, we found that teachers had
considerably higher likelihoods of moving schools or leaving teaching entirely if they taught
mathematics and science, special education, or foreign languages, in comparison to elementary
school teachers, who are the least likely to move or leave. Holding all else constant, mathematics
and science teachers have a predicted turnover rate 37% greater than elementary teachers, special
education teachers have a rate 46% higher, and foreign language teachers have a rate 87% higher
(see Figure 20).
0%
5%
10%
15%
20%
25%
30%
Note: Brackets represent 95% confidence interval of the estimate.
Source: Learning Policy Institute analysis of National Center for Education Statistics Schools and Staffing Survey, 2011–12
and Teacher Follow-up Survey, 2012–13.
Predicted Turnover Rate by Subject Area
PREDICTED TURNOVER RATE
Elementary Mathematics and Science Special Education Foreign Language
MAIN TEACHING SUBJECT
10.7%
14.7%
15.6%
20.0%
Workplace Conditions
Our fourth model added workplace conditions to the equation, including compensation and a variety
of school working conditions, some of which prove signicant in predicting teacher turnover.
Compensation
Previous research indicates that teachers are more likely to continue teaching and stay at their
schools when their wages increase and are comparable with job opportunities in other industries
or in nearby school districts.
50
In addition to wage comparability, data from the National Center for
Education Statistics 5-year longitudinal study show that teachers whose rst-year salary was less

LEARNING POLICY INSTITUTE | TEACHER TURNOVER: WHY IT MATTERS AND WHAT WE CAN DO ABOUT IT 28
than $40,000 had an attrition rate 10 percentage points higher than teachers who earned more in
their rst year.
51
This analysis controlled for beginning salaries in each district, adjusted by the Comparable Wage
Index (CWI), a measure of noneducator wage comparability across labor markets (see Technical
Appendix, page 35). Secondly, it included the highest possible district salaries, adjusted by the CWI.
The purpose of including both of these measures is to account for the range of salaries teachers
can expect over the course of their careers. In some cases, districts have higher beginning salaries
to attract teachers but relatively low salary increases over time. Other districts have may have low
beginning salaries, but teachers can earn higher wages as they become more experienced.
We found that the level of beginning teacher salaries was not predictive of teacher turnover after
controlling for district type, class size, and other school factors; however, the highest possible
district salary was related to teacher turnover (see Figure 21). That is, teachers who could one day
expect to earn more than $78,000 at the highest end of their district salary schedules—the top
quintile of teachers— had a predicted turnover rate 31% lower than those with maximum district
salaries less than $60,000—the bottom quintile of teachers. Teachers in districts that offered
salaries up to $72,000 to $78,000 were 20% less likely to turn over than those in the bottom quintile.
Figure 21
0%
2%
4%
6%
8%
10%
12%
14%
16%
18%
Note: Brackets represent 95% confidence interval of the estimate.
Source: Learning Policy Institute analysis of National Center for Education Statistics Schools and Staffing Survey, 2011–12
and Teacher Follow-up Survey, 2012–13.
Predicted Turnover Rate by Highest District Salary
PREDICTED TURNOVER RATE
Less than $60,000 $60–66,000 $66–72,000 $72–78,000 Greater than $78,000
HIGHEST TEACHER SALARY POSSIBLE IN DISTRICT
13.9%
12.8%
11.9%
11.1%
9.6%

LEARNING POLICY INSTITUTE | TEACHER TURNOVER: WHY IT MATTERS AND WHAT WE CAN DO ABOUT IT 29
Figure 22
Teaching conditions
Researchers have identied several workplace conditions associated with teacher turnover,
including experiences with professional development, facilities, teaching resources, parental
involvement, instructional leadership, time for collaboration and planning, school culture, collegial
relationships, and decision-making power.
52
A review of the literature concerning teacher turnover
and working conditions found that school leadership, collegial relationships, and school culture are
of particular importance to teacher retention.
53
Our analysis reinforces some of these ndings. With controls for student and teacher
characteristics, we found that the workplace condition most predictive of teacher turnover
was a perceived lack of administrative support, a construct that measures how teachers rate an
administrator’s ability to encourage and acknowledge staff, communicate a clear vision, and
generally run a school well.
When teachers strongly disagree that their administration is supportive,
they are more than twice as likely to move schools or leave teaching than when they strongly agree
that their administration is supportive (see Figure 22). This nding is consistent with other studies
that similarly have found that more effective principals were associated with higher rates of teacher
satisfaction and lower teacher turnover, especially in high-needs schools.
54
0%
5%
10%
15%
20%
25%
30%
35%
Note: Brackets represent 95% confidence interval of the estimate.
Source: Learning Policy Institute analysis of National Center for Education Statistics Schools and Staffing Survey, 2011–12
and Teacher Follow-up Survey, 2012–13.
Predicted Turnover Rate by Teacher Reports of Administrative Support
PREDICTED TURNOVER RATE
Strongly Agree Somewhat Agree Somewhat Disagree Strongly Disagree
ADMINISTRATION IS SUPPORTIVE
10.5%
11.8%
13.3%
23.6%
Holding all else constant, including administrative support, we did not nd independent, signicant
effects on turnover of other workplace conditions, including student behavior, parent support,
school resources, duties and paperwork that interfere with teaching, collegial support, concerns
about job security due to accountability measures, classroom control, or teacher inuence over
school decisions. It is possible that the strong impact of administrative support on turnover in our
model subsumes many of these variables, since school leaders have an effect on most aspects of
school operations, including virtually all of these factors.

LEARNING POLICY INSTITUTE | TEACHER TURNOVER: WHY IT MATTERS AND WHAT WE CAN DO ABOUT IT 30
Summary of the Findings
At 8% annually, teacher attrition in the United
States is high relative to that of other high-
achieving countries, where teachers often leave
the profession at half that rate or less. More than
two-thirds of this attrition is due to reasons other
than retirement. For most teachers, the decision
to leave is associated with dissatisfactions with
teaching. Among the most prominent reasons for
dissatisfaction in recent years have been pressures
associated with test-based accountability,
unhappiness with administrative support, and
dissatisfaction with teaching as a career. Teachers
also report that they leave for both nancial and
personal reasons.
In addition to those who leave the profession each year, another 8% of teachers move between
schools, creating costs and disruptions in the schools they leave behind. High rates of attrition have
signicant nancial costs, which can exceed $20,000 per teacher for replacing one who leaves in an
urban school district. Attrition also carries costs for student learning, as high turnover rates reduce
achievement for students whose classrooms are directly affected and for other students in the school.
Overall turnover rates are highest in the South, while they are lowest in the higher-paying
northeastern states, which also feature smaller class sizes and greater investments in education.
Teachers of mathematics, science, special education, English language development, and foreign
languages are more likely to leave their school or the profession than those in other subjects. These
are teaching elds that experience shortages in most states across the country.
Data show that teachers are more likely to leave schools where there are more students of color
and more low-income students, where salaries are lower, and where working conditions are poorer.
These are frequently conditions that coexist. In schools with a majority of low-income students
and students of color, turnover rates can be double the rates in schools with more White students
and fewer low-income students. These schools wind up with teachers who have fewer years of
experience and, often, signicantly less training to teach.
These factors are associated with the high turnover rates of teachers of color, who
disproportionately teach in high-minority, low-income schools and who are also significantly
more likely to enter teaching without having completed their training. Mathematics and science
teachers are also more likely to enter teaching through alternative pathways that typically
provide less training.
Teachers who enter the profession through alternative certication pathways are much more
likely to leave their schools and the profession, especially when they teach in schools with high
proportions of students of color. These teachers—who constituted 25% of entering teachers in 2012
and a higher share in the neediest schools—have had less coursework and student teaching, on
average, than teachers who are prepared through traditional programs. This predicts high rates of
Among the most prominent
reasons for dissatisfaction in
recent years have been pressures
associated with test-based
accountability, unhappiness
with administrative support, and
dissatisfaction with teaching as a
career.
LEARNING POLICY INSTITUTE | TEACHER TURNOVER: WHY IT MATTERS AND WHAT WE CAN DO ABOUT IT 31
leaving, even after controlling for other student and teacher characteristics and working conditions.
Ironically, while policymakers often seek to address shortages of mathematics and science teachers,
as well as teachers of color, the use of shortcut training programs exacerbates the turnover that
keeps shortages prevalent.
Other factors that are highly predictive of teacher turnover in statistically controlled models
are lack of administrative support, maximum district salaries, school size, and the proportion of
students of color. Teachers in districts with the highest salary scales, who are better prepared, and
who feel the most supported by their school leaders, are least likely to leave their school or teaching
altogether.

LEARNING POLICY INSTITUTE | TEACHER TURNOVER: WHY IT MATTERS AND WHAT WE CAN DO ABOUT IT 32
Policy Considerations
Retaining teachers requires a comprehensive approach that ensures teachers are well prepared for the
challenges of teaching, compensates them adequately for their labor, and provides the teaching and
learning environments that support their growth and help them to be effective. With high turnover
rates across the board, policymakers should pursue strategies that can advance these goals in all
schools, but especially in those where turnover rates are most extreme—schools serving students
of color and students in poverty. We highlight policy considerations below that address the ndings
of this report. For a more comprehensive review of recruitment and retention strategies, see our
companion report: Solving the teacher shortage: How to attract and retain excellent educators.
55
Compensation
As in countries with well-developed teaching systems, states and districts should work to provide
compensation packages that are competitive with those of other occupations requiring similar
levels of education and that are equitable across districts, so all schools can compete in the labor
market for well-prepared teachers.
Currently, salaries vary widely across and within
states, and these differences are associated
with both attrition rates and shortage levels.
56
Reecting on her choice to move from an
Oklahoma school to one across the border in
Arkansas, Alishia Morris recalled, “It wasn’t the
school’s fault. If it was, it wouldn’t have been so
difcult for me to leave. It’s just that Arkansas
has more resources—they just make teaching
easier.” Morris received a salary increase of
about 25%, the support of reading and mathematics facilitators for her students, a $500 materials
allowance, and opportunities for professional development from a mentor teacher.
57
Overall, however, teacher salaries have declined since the 1990s. One recent report found that in 30
states, teacher wages are so low that a teacher with 10 years of experience heading a family of four
would qualify for several forms of government assistance.
58
While beginning teacher salaries may
be more important for recruiting than retaining teachers, the prospect of a reasonable salary at the
highest end of the district salary schedule does inuence teacher retention decisions.
Federal and state governments can also provide other forms of compensation that reduce the debt
burden of teaching, which is currently severe for most college students.
59
Service scholarship and
loan forgiveness programs that pay the cost of teacher preparation in exchange for a commitment
to teach in a subject or location of need for 3–5 years can help retain teachers in two ways: (1) they
provide the nancial incentive for teachers to continue teaching, and (2) they draw prospective
teachers into the workforce through high-quality preparation programs associated with greater
teacher retention.
Salaries vary widely across
and within states, and these
differences are associated with
both attrition rates and shortage
levels.

LEARNING POLICY INSTITUTE | TEACHER TURNOVER: WHY IT MATTERS AND WHAT WE CAN DO ABOUT IT 33
Loan forgiveness and service scholarships can be particularly useful when targeted to the subjects
and schools where teachers are least likely to be well prepared and where turnover is greatest:
mathematics, science, special education, and in schools serving students of color and students
in poverty.
The federal government has long provided such supports to medical personnel in shortage elds
and for shortage locations, and once provided robust scholarships to teachers as well, though these
have dwindled in recent years. Research shows that college students’ potential debt burdens have an
inuence on their decisions about what profession to enter, and that these kinds of incentives are
effective in recruiting and retaining individuals in teaching and other professions.
60
Teacher Preparation and Support
In addition to service scholarships and loan
forgiveness programs that allow teachers
to complete a strong preservice teacher
preparation program without incurring
substantial student debt, other high-retention
pathways into teaching can provide new
teachers with the skills they need to be
successful in and available to the high-need
communities where they are most needed.
In teacher residency programs, based on the
medical residency model, residents train in
high-needs schools for an entire school year under the guidance and supervision of a master
teacher, while earning a credential and a master’s degree from a partnering university. Most
programs offer tuition assistance and a stipend for living expenses, plus two years of mentoring
after the training year.
In exchange, residents commit to teaching in the district for 3 to 5 years after their residency year.
This has the triple benet of ltering out candidates not willing to make a serious commitment to
teach, ensuring that they are well prepared for the particular context in which they will teach, and
continue to teach in high-needs schools as their effectiveness increases.
61
Teacher residencies have
been successful at recruiting teachers of color and mathematics and science teachers to high-need
urban and rural districts, and yield above-average teacher retention rates even after 5 years.
62
Grow your own teacher preparation models create a pool of potential teachers by recruiting high
school students, paraprofessionals, after-school program staff, or other local community members
into teaching. These models capitalize on the fact that teachers are more likely to stay and continue
teaching in their own communities. Grow your own models often provide incentives to participants
to pursue teacher training through the kind of high-quality preparation programs associated with
improved teacher retention. For instance, California’s Paraprofessional Teacher Training Program,
funded from 1995 to 2011 and renewed in 2016, successfully recruited, supported, and funded
community college, bachelor’s degrees, and teacher preparation expenses for more than 2,200
racially and linguistically diverse paraprofessionals to become fully certied teachers by 2014.
By the 13th year of the program’s operation, program sponsors reported that 92% of graduates
continued to be California public school teachers.
63
High-retention pathways into
teaching can provide new teachers
with the skills they need to be
successful in and available to the
high-need communities where
they are most needed.

LEARNING POLICY INSTITUTE | TEACHER TURNOVER: WHY IT MATTERS AND WHAT WE CAN DO ABOUT IT 34
Districts should provide high-quality mentoring and induction to beginning teachers, and in
particular, should consider how these supports can meet the needs of a diverse workforce. Induction
programs that include being assigned a mentor, meeting frequently, and focusing on high-
leverage activities—observation and feedback; analyzing student strengths and needs; discussing
instructional issues; and developing a professional growth plan—have been found to result in
improved teacher retention.
64
School Leadership
Effective leadership is at the heart of every
school and drives high-quality support for new
teachers and improved teaching conditions.
To develop strong school leaders, state
policymakers, in partnership with local education
agencies, school leadership training programs,
and other key stakeholders, can develop rigorous
training program accreditation and principal
licensure standards aligned with research on
effective school leadership, as well as systems for
regular program review by qualied experts.
As provided in Title II of the Every Student
Succeeds Act, federal and state governments can
fund residencies for principal training and
state leadership academies that coordinate
mentoring and professional learning to develop school leadership capacity to build and nurture
school settings that encourage teacher retention. These approaches have been found effective in
developing leaders who both support effective teaching and enable stronger student learning.
65
Districts can also consider strategies for ensuring principals enter leadership positions with
the skills needed to nurture positive school environments, such as partnering with local
administrative credential programs to determine and support competencies participants need
to develop; nominating and subsidizing teachers who show instructional leadership skills to
pursue administrative credentials; nominating and training mentor principals to provide high-
quality clinical training experiences; creating principal pipeline programs that focus on the skills
administrators need to be effective as both assistant principals and principals; and assigning highly
qualied and experienced administrators to the schools in need of the greatest support.
Conclusion
Among in-school factors, teachers have the greatest direct impact on student learning. Effectively
retaining teachers is crucial to making sure there are enough well-prepared and committed
teachers to staff all of our nation’s schools and that the teachers in our classrooms have the time
and experience to effectively serve all students. Tailored policy interventions can play a role
in addressing the key factors that drive teachers from their schools, stabilizing and ultimately
improving the teacher workforce so that it can serve all students well.
To develop strong school
leaders, state policymakers, in
partnership with local education
agencies, school leadership
training programs, and other
key stakeholders, can develop
rigorous training program
accreditation and principal
licensure standards.

LEARNING POLICY INSTITUTE | TEACHER TURNOVER: WHY IT MATTERS AND WHAT WE CAN DO ABOUT IT 35
Technical Appendix
Data
This paper draws primarily from the U.S. Department of Education, National Center for Education
Statistics Schools and Stafng Survey (2011–12) and Teacher Follow-up Survey (2012–13).
The Schools and Stafng Survey (SASS) is a set of questionnaires administered to a nationally
representative sample of teachers across the country in 1987–88, 1990–91, 1993–94, 1999–2000,
2003–04, 2007–08, and 2011–12. District and school personnel also complete questionnaires to
provide contextual information on the schools and districts where teachers teach.
The Teacher Follow-up Survey (TFS) has three components: (1) the Teacher Status Form, (2) a
questionnaire for former teachers, and (3) a questionnaire for current teachers. The year the SASS is
administered is referred to as the “base year.” The following year, or the “current year,” the Teacher
Status Form is sent to all schools that had at least one teacher complete the SASS in the base year.
The principal, or other knowledgeable staff member, indicates the current year occupational status
of any of those teachers.
66
This form yields data for most SASS completers with a response rate of
79.6%. The former and current teacher questionnaires, in contrast, are administered to a subset
of SASS respondents. The TFS in 2012–13 includes all SASS respondents who indicated they were
rst-year teachers, then a sample of SASS respondents stratied, in order, by school sector (i.e.,
public or private), teacher status (stayer, who continues teaching at the same school, leaver, mover,
or unknown), experience, grade level, and race/ethnicity. Finally, the TFS dataset is completed with
imputed data and sampling weights.
a
In addition, this study draws in small part from previous years of the SASS and TFS and from the
Beginning Teacher Longitudinal Survey (BTLS), which followed a cohort of beginning teachers
from 2007–08 to 2011–12. The BTLS began with a subset of teachers surveyed for the 2007–08
SASS and 2008–09 TFS. The BTLS includes data on teacher preparation, induction, and mentoring
experiences.
All estimations of means, differences in means, and regression modeling account for the survey
structure of the data and use balanced, repeated replication to compute standard errors. This report
also includes overall turnover data from SASS and TFS surveys from 1988 to 2009. Movers and
leavers are combined into non-stayers in order to capture all movement of full-time teachers out of
public schools. While macro-level supply may not change when teachers move schools, if teachers
move out of schools with particular characteristics, it will result in a disproportionate impact on
certain students. It is important to model the overall nature of teacher mobility and its effect on
schools and students to better inform policymaking.
Methodology
Section I of this study reports descriptive statistics and differences of means test results to
identify differences in turnover rates across teacher and school characteristics. Then we use a
a. The NCES Handbook of Survey Methods includes a thorough discussion of the survey methods used to
produce the SASS and TFS data.

LEARNING POLICY INSTITUTE | TEACHER TURNOVER: WHY IT MATTERS AND WHAT WE CAN DO ABOUT IT 36
logistic regression model to examine the relationship between teacher turnover and a series of
school characteristics, teacher characteristics, and workplace conditions. The outcome of interest
is the probability that a teacher will leave his or her school to move to another school or will leave
the profession.
Consistent with prior literature, we control for teacher gender and age. Age has a U-shaped
relationship with turnover, and so we control for teachers younger than 30 and older than 50.
67
School size is a measure of the number of students enrolled in a school during the base year and
is measured as a categorical variable (bins of 49 from 1 to 199, bins of 149 to 499, bins of 249 to
999, then 1,000–1,199, 1,200–1,499, 1,500–1,999, and 2,000 or more students). Secondary school
is an indicator variable that is 1 when the base year school is either a secondary school or includes
middle or high school grades (i.e., 6–8, 8–12, 6–12, k–8 or k–12). The variable is 0 when the school
is just an elementary school. Bivariate analyses of urbanicity detected a signicant relationship
between teaching in a city and higher turnover. City and rural teachers are included as control
variables while teachers in suburbs and towns are omitted.
b
We divide all teachers into quartiles by the percentage of students eligible for the National School
Lunch Program (NSLP) at their school. The bottom quartile of teachers teach at schools with the
fewest eligible students, and the top quartile teach at schools with the most eligible students. We
also include an interaction term that controls for NSLP quartile and teaching at a school located
in a city. Teachers in schools with the most NSLP-eligible students, located in cities, have higher
turnover rates than either teachers in the top quartile of NSLP-eligible schools or teachers in cities.
We also create a variable representing the percentage of students of color in a school, such that the
bottom quartile of teachers teach in schools with the fewest students of color (less than 10%), and the
top quartile of teachers teach in schools with the most students of color (greater than 55%). Students
of color are non-White students in a school and include Asian American, Pacic Islander, Black,
Latino, Native American, and multiracial students. Of course, these groups are heterogeneous both
internally and across racial categories. However, we expect to nd some similar trends among students
of color. The students of color category yields a conservative estimate of some of those trends, which
are more extreme when looking at outcomes concerning Black and Latino students alone.
The teachers of color variable is a self-reported indicator signifying a teacher identies as non-
White, including Asian American, Pacic Islander, Black, Latino, and Native American, or any
combination, including one or more of those identications. Non-Hispanic White teachers are
represented as 0.
Alternative pathway is an indicator variable signifying a teacher reports s/he entered teaching
through an alternative certication program and 0 if s/he indicates entering through a regular
pathway. It should be noted that regular pathway and regular certication are not interchangeable
terms. A teacher who enters teaching through an alternative pathway may eventually complete all
the requirements to earn a regular certication but would still be an alternative pathway teacher.
For elementary school teachers and other self-contained classroom teachers, average class size is
the mean of the class size that those teachers report in the base year. For secondary school teachers,
b. For more information, please refer to Documentation to the NCES Common Core of Data Public
Elementary/Secondary School Universe Survey: School Year 2009–10 (NCES 2008–332).
LEARNING POLICY INSTITUTE | TEACHER TURNOVER: WHY IT MATTERS AND WHAT WE CAN DO ABOUT IT 37
average class size is the mean of the number of students they have in each class or section they
teach in the base year. Push-in and pull-out teachers are excluded from this portion of the analysis,
since they do not manage a full class in the same way that classroom teachers do. Self-contained
special education classes are included in class size; however, we also control for a teacher’s main
assignment being special education. We divide average class size into quartiles from 12 to greater
than 50 students.
We include a set of binary variables for main teaching subject according to teachers’ self-reported
main teaching subject. Humanities combines English and Social Studies. Mathematics and Science
combines all mathematics and natural science subjects.
We create working condition constructs from survey responses, using Cronbach’s alpha to combine
multiple responses on the same topic. All Cronbach alphas are equal to at least 0.7. Variables
include the following:
• Administrative support is a construct that measures teacher attitudes on four questions
about their administrator and is on a scale from 1 to 4, where 1 is the most favorable
attitude toward their administrator and 4 is the least favorable attitude.
• Student behavior problems is a construct created from seven survey responses about whether
student behaviors are a problem (i.e., tardiness, misbehavior).
• Parent support is a measure of whether teachers agree that they have the support they need
from parents. A 1 means they strongly agree that they have parent support and 4 means
that they strongly disagree.
• Resources is a measure of whether teachers agree that resources are available to them in
their school, where 1 means they strongly agree that they have resources available and 4
means they strongly disagree.
• Interference is a measure of whether teachers believe that paperwork and other duties
interfere with their teaching time. A 1 means they strongly disagree that paperwork and
duties interfere with their teaching time and 4 means they strongly agree.
• Collegiality is a construct that combines three survey questions that measure the degree
to which staff collaborate and hold similar values and is scaled from 1 to 4. A 1 represents
the most positive attitude of colleagues and 4 represents the least positive attitudes about
colleagues.
• Job security is a measure of how worried teachers are about their job security due to
assessment and accountability measures. A 1 indicates that a teacher strongly disagrees
that s/he is worried and 4 indicates that a teacher strongly agrees that s/he is worried about
job security.
• Classroom control and school inuence are constructs created from six and seven survey
questions, respectively, and measure the degree of either control or inuence a teacher
feels s/he has. A 1 represents having the most control or inuence and 4 represents
having none at all.
We also control for the lowest starting salary in the district and the highest possible salary in the
district, based on district reports of average beginning salaries and the highest salaries offered.
These data are reported by districts through the district SASS questionnaire and merged to
teacher data les. We use the Comparable Wage Index, a measure of non-teaching professional
LEARNING POLICY INSTITUTE | TEACHER TURNOVER: WHY IT MATTERS AND WHAT WE CAN DO ABOUT IT 38
salaries, controlling for age, education, and hours worked, to account for geographical variation
in wages. The CWI can be used to adjust teacher salaries that may differ due to prevailing local
wages—an indicator of cost of living. Each school district is linked to a labor market based on
the Common Core of Data. For more details, see NCES documentation.
68
Finally, beginning and
highest teacher salaries are divided into quintiles.
Our results are similar whether we include each working condition as a separate variable in our
model or create a construct where working conditions vary from worst working conditions overall to
best working conditions overall. For a complete list of variables and their means overall and across
teacher subgroups, see Table A-1 below.
For simplicity sake, the models shown below do not list separately each variable included in the
model; however, all variables included can be found in Table A-1 (see page 40). We rst estimate
a basic model that includes school characteristics, Model 1. Model 2 includes school and teacher
characteristics. Model 3 adds in main teaching subject, and Model 4, the preferred model, includes
school characteristics, teacher characteristics, main teaching subject, and working conditions.
Model 1:
log p(attrite) / (1-p(attrite)) =
β
0
+S
β
1
,
where S is all school characteristics
Model 2:
log p(attrite) / 1-p(attrite) =
β
0
+S
β
1
+T
β
2
,
where S is all school characteristics and T is all teacher characteristics
Model 3:
log p(attrite) / (1-p(attrite)) =
β
0
+S
β
1
+T
β
2
+M
β
2
,
where S is all school characteristics, T is all teacher characteristics, and M is main teaching subject
Model 4:
log p(attrite) / (1-p(attrite)) =
β
0
+S
β
1
+T
β
2
+M
β
2
+W
β
2
,
where S is all school characteristics, T is all teacher characteristics, M is main teaching subject, and W is
all working conditions
Using the Pearson chi-square goodness of t test, the preferred model has a p-value of .9030,
indicating that the model does indeed t our observations.
Table A-2 (see pp. 41-42) displays the odds ratios estimated for each model. Odds ratios are used
to compare the relative odds of the occurrence of the outcome of interest (in this case, leaving
teaching at a given school), given certain other factors (e.g., school level, working conditions,
salaries, etc.). The odds ratio can also be used to determine whether a particular factor is a risk
factor for a particular outcome and to compare the magnitude of various risk factors for that
outcome. Coefcients can be interpreted as follows:
• When the odds ratio is equal to 1, the factor is not associated with the odds of the outcome
• When the odds ratio is greater than 1, the factor is associated with higher odds of the
outcome
• When the odds ratio is less than 1, the factor is associated with lower odds of the outcome
LEARNING POLICY INSTITUTE | TEACHER TURNOVER: WHY IT MATTERS AND WHAT WE CAN DO ABOUT IT 39
After estimating the preferred logistic regression model, we predict the probability of teacher
turnover (moving or leaving) given a variety of conditions. Reporting predicted probabilities allows
for a more intuitive interpretation of the regression outcomes. In this report, predicted probabilities
hold all other variables constant at their means. For example, when predicting turnover given
administrative support, only administrative support varies from 1 to 4, which is reported along the
horizontal axis. Meanwhile, all other variables (teacher characteristics, student characteristics, and
working conditions) are held at their mean value.

LEARNING POLICY INSTITUTE | TEACHER TURNOVER: WHY IT MATTERS AND WHAT WE CAN DO ABOUT IT 40
Table A-1: Independent Variable Means for Teachers Overall; Teachers of Color; Teachers of Mathematics &
Science and Special Education; and Teachers from Alternative Pathways
Overall Mathematics & Science Special Education Teachers of Color Alternative Pathway
Mean SD Mean SD Mean SD Mean SD Mean SD
School size 7.50 2.17 8.23 2.84 7.36 2.22 7.82 1.84 7.95 2.26
Secondary school 0.37 0.48 0.62 0.58 0.36 0.49 0.34 0.40 0.48 0.49
Quartile % NSLP eligible 1.67 1.15 1.55 1.37 1.74 1.15 2.26 0.86 1.95 1.08
Quartile % students of color 1.82 1.11 1.77 1.33 1.84 1.12 2.68 0.56 2.20 0.99
Quartile class size 1.62 1.15 1.58 1.18 1.80 1.78 1.57 0.94 1.55 1.12
Rural 0.29 0.45 0.30 0.55 0.27 0.45 0.18 0.32 0.26 0.43
City 0.27 0.44 0.25 0.52 0.28 0.46 0.45 0.42 0.35 0.46
Female 0.76 0.43 0.64 0.57 0.86 0.35 0.74 0.37 0.69 0.45
Older than 50 0.28 0.45 0.24 0.51 0.30 0.47 0.26 0.37 0.23 0.41
Younger than 30 0.15 0.36 0.17 0.45 0.16 0.37 0.13 0.28 0.14 0.34
Teacher of color 0.18 0.38 0.17 0.45 0.18 0.39 1.00 0.00 0.31 0.45
Alternative pathway teacher 0.15 0.35 0.21 0.49 0.17 0.38 0.25 0.36 1.00 0.00
Total years of experience 13.76 9.35 12.97 10.89 12.90 9.55 12.17 7.24 9.05 6.19
Main assignment: Mathematics and science 0.16 0.37 1.00 0.00 (omitted) (omitted) 0.15 0.30 0.23 0.41
Main assignment: Humanities 0.17 0.38 (omitted) (omitted) (omitted) 0.16 0.31 0.18 0.37
Main assignment: Special education 0.12 0.33 (omitted) 1.00 0.00 0.12 0.27 0.15 0.34
Main assignment: English language
development
0.02 0.13 (omitted) (omitted) (omitted) 0.04 0.17 0.02 0.13
Main assignment: Arts 0.05 0.22 (omitted) (omitted) (omitted) 0.03 0.13 0.04 0.19
Main assignment: Foreign languages 0.03 0.16 (omitted) (omitted) (omitted) 0.06 0.19 0.04 0.19
Main assignment: Physical education 0.05 0.22 (omitted) (omitted) (omitted) 0.05 0.19 0.04 0.18
Main assignment: Career technical
education
0.04 0.21 (omitted) (omitted) (omitted) 0.03 0.15 0.08 0.26
Main assignment: Miscellaneous 0.00 0.06 (omitted) (omitted) (omitted) 0.01 0.08 0.01 0.08
Administrative support 1.82 0.79 1.90 0.94 1.78 0.78 1.84 0.70 1.87 0.81
Student behavior 2.10 0.74 2.36 0.89 2.05 0.75 2.16 0.64 2.24 0.74
Parent support 2.44 0.91 2.60 1.05 2.41 0.92 2.51 0.80 2.57 0.91
Resources 1.86 0.87 1.84 1.04 1.93 0.90 1.96 0.78 1.96 0.90
Interferences 2.89 0.92 2.86 1.06 3.08 0.90 2.90 0.79 2.88 0.89
Collegiality 1.91 0.72 2.04 0.85 1.91 0.70 1.97 0.65 2.02 0.74
Job security 2.31 1.00 2.35 1.19 2.35 1.01 2.40 0.86 2.37 0.99
Control 1.67 0.64 1.68 0.71 1.64 0.65 1.72 0.55 1.73 0.65
Influence 2.88 0.70 2.91 0.80 2.85 0.69 2.87 0.65 2.97 0.69
District beginning salary 2.07 1.39 2.06 1.67 2.09 1.40 2.24 1.10 2.16 1.36
District highest salary 2.06 1.43 2.05 1.74 2.15 1.45 1.94 1.17 1.74 1.39
Source: Learning Policy Institute analysis of National Center for Education Statistics Schools and Staffing Survey, 2011–12.

LEARNING POLICY INSTITUTE | TEACHER TURNOVER: WHY IT MATTERS AND WHAT WE CAN DO ABOUT IT 41
Table A-2
Logistic Regression Odds Ratios: Probability of Teachers Moving or Leaving
Independent Variables Model 1 Model 2 Model 3 Model 4
School size 0.926*** 0.925*** 0.920*** 0.916***
-0.0179 -0.0176 -0.0177 -0.0164
Secondary school
1.074 1.033 0.913 0.89
-0.0906 -0.0925 -0.0846 -0.0956
2nd quartile % eligible for NSLP
1.098 1.106 1.1 1.062
-0.141 -0.143 -0.142 -0.133
3rd quartile % eligible for NSLP
1.098 1.092 1.085 0.993
-0.124 -0.126 -0.124 -0.117
Top quartile % eligible for NSLP
1.235 1.208 1.206 1.092
-0.14 -0.141 -0.139 -0.13
2nd quartile % students of color enrolled
1.144 1.134 1.135 1.137
-0.122 -0.124 -0.123 -0.12
3rd quartile % students of color enrolled
1.549** 1.506** 1.519** 1.477**
-0.195 -0.19 -0.191 -0.189
Top quartile % students of color enrolled color
1.722*** 1.632*** 1.659*** 1.524**
-0.219 -0.211 -0.212 -0.202
Average class size
1.042 1.054 1.033 1.036
-0.039 -0.0402 -0.0377 -0.0372
Rural
1.029 1.028 1.031 0.976
-0.0908 -0.0909 -0.0906 -0.0843
City
1.105 1.086 1.098 1.074
-0.129 -0.127 -0.128 -0.121
Female
0.977 1.005 0.978
-0.0945 -0.107 -0.101
Older than 50
1.435** 1.419** 1.397**
-0.151 -0.147 -0.153
Younger than 30
2.162*** 2.172*** 2.229***
-0.239 -0.243 -0.242
Teacher of color
1.079 1.054 1.076
-0.13 -0.13 -0.135
Alternative pathway
1.365** 1.324** 1.251**
-0.142 -0.137 -0.126
Total years of experience
0.999 1 1
-0.00598 -0.00593 -0.00619
Main assignment: Mathematics and science
1.391** 1.367**
-0.156 -0.159
Main assignment: Humanities
1.228 1.211
-0.141 -0.142
Main assignment: Special education
1.380** 1.454**
-0.198 -0.205
Main assignment: English language development
1.283 1.376
-0.648 -0.703
Main assignment: Arts
1.192 1.257
-0.178 -0.201
Main assignment: Foreign languages
1.814** 1.910**
-0.357 -0.397
Main assignment: Physical education
1.329 1.412
-0.307 -0.33
Main assignment: Career technical education
1.417 1.439

LEARNING POLICY INSTITUTE | TEACHER TURNOVER: WHY IT MATTERS AND WHAT WE CAN DO ABOUT IT 42
Table A-2 Logistic Regression Odds Ratios: Probability of Teachers Moving or Leaving (continued)
Independent Variables Model 1 Model 2 Model 3 Model 4
-0.28 -0.295
Main assignment: miscellaneous
1.326 1.28
-0.807 -0.847
Administrative support: somewhat agree
1.14
-0.108
Administrative support: somewhat disagree
1.304**
-0.161
Administrative support: strongly disagree
2.629***
-0.606
Student behavior problems
1.047
-0.0685
Lack of parent support
1.031
-0.0578
Lack of resources
1.005
-0.0457
Teaching interferences
1.013
-0.0489
Lack of collegiality
1.039
-0.072
Lack of job security
0.941
-0.0403
Lack of classroom control
1.146
-0.0807
Lack of school influence
1.115
-0.073
Beginning salary ($32.000–34,000)
0.927
-0.11
Beginning salary ($34,000–36,000)
0.946
-0.121
Beginning salary ($36,000–41,000)
1.03
-0.114
Beginning salary (Greater than $41,000)
1.028
-0.144
Highest salary ($60,000–66,000)
0.913
-0.106
Highest salary ($60,000–72,000)
0.84
-0.0962
Highest salary ($72,000–78,000)
0.777**
-0.0947
Highest salary (Greater than $78,000)
0.658**
-0.0891
Constant
0.143*** 0.113*** 0.102*** 0.0630***
-0.0259 -0.0252 -0.0239 -0.0187
Observations 26,916 26,916 26,916 26,916
Population size 2,473,469 2,473,469 2,473,469 2,473,469
McKelvey & Zavoina’s R
2
0.71 0.834 0.846 0.894
Standard error in parentheses
*** p<0.001, **p<0.01, * p<0.05
Source: Learning Policy Institute analysis of National Center for Education Statistics Schools and Staffing Survey, 2011-12, and
Teacher Follow-up.
LEARNING POLICY INSTITUTE | TEACHER TURNOVER: WHY IT MATTERS AND WHAT WE CAN DO ABOUT IT 43
Endnotes
1. For a thorough analysis of teacher supply and demand conditions, see: Sutcher, L., Darling-Hammond, L.,
& Carver-Thomas, D. (2016). A coming crisis in teaching? Teacher supply, demand, and shortages in the U.S.
Palo Alto, CA: Learning Policy Institute.
2. Sutcher, L., Darling-Hammond, L., & Carver-Thomas, D. (2016). A coming crisis in teaching? Teacher supply,
demand, and shortages in the U.S. Palo Alto, CA: Learning Policy Institute.
3. Sutcher, L., Darling-Hammond, L., & Carver-Thomas, D. (2016). A coming crisis in teaching? Teacher supply,
demand, and shortages in the U.S. Palo Alto, CA: Learning Policy Institute.
4. Kini, T., & Podolsky, A. (2016). Does teaching experience increase teacher effectiveness? A review of the
research. Palo Alto: Learning Policy Institute.
5. Ronfeldt, M., Loeb, S., & Wyckoff, J. 2013. “How Teacher Turnover Harms Student Achievement.” American
Educational Research Journal 50 (1): 4–36. doi:10.3102/0002831212463813.
6. Barnes, G., Crowe, E., & Schaefer, B. (2007). The cost of teacher turnover in ve school districts: A pilot study.
Washington, DC: National Commission on Teaching and America’s Future. (Cost adjusted for ination
using the Bureau for Labor Statistics Consumer Price Index Ination Calculator.)
7. Sutcher, L., Darling-Hammond, L., & Carver-Thomas, D. (2016). A coming crisis in teaching? Teacher supply,
demand, and shortages in the U.S. Palo Alto, CA: Learning Policy Institute.
8. Goldring, R., Taie, S., & Riddles, M. (2014). Teacher Attrition and Mobility: Results from the 2012–13 Teacher
Follow-up Survey. National Center for Education Statistics, 1–40.
9. Darling-Hammond, L., Burns, D., Campbell, C., Goodwin, A. L., Hammerness, K., Low, E. L., McIntyre, A.,
Sato, M., & Zeichner, K. (2017). Empowered Educators: How Leading Nations Design Systems for Teaching
Quality. San Francisco, CA: Jossey-Bass.
10. Sutcher, L., Darling-Hammond, L., & Carver-Thomas, D. (2016). A coming crisis in teaching? Teacher supply,
demand, and shortages in the U.S. Palo Alto, CA: Learning Policy Institute.
11. NEA Collective Bargaining/Member Advocacy’s Teacher Salary Database, based on afliate reporting as of
December 2013, see http://www.nea.org/home/2012-2013-average-starting-teacher-salary.html; Baker,
B., Farrie, D., & Sciarra, D. G. (2016). Mind the Gap: 20 years of progress and retrenchment in school funding
and achievement gaps, Table 5. Educational Testing Service: Princeton, NJ, pp. 15.
12. Scholastic and the Bill and Melinda Gates Foundation. (2012). Primary sources: America’s teachers on the
teaching profession. New York. Retrieved from http://mediaroom.scholastic.com/les/ps_fullreport.pdf.
13. Sutcher, L., Darling-Hammond, L., & Carver-Thomas, D. (2016). A coming crisis in teaching? Teacher supply,
demand, and shortages in the U.S. Palo Alto, CA: Learning Policy Institute.
14. Estimates for teachers whose main assignment is teaching English to English language learners are
unfortunately imprecise due to small sample size. They comprise less than 2% of all teachers in our
sample. Therefore, high ELD teacher turnover rates should be interpreted with caution. It is also difcult
to separate English language instruction from school characteristics, like Title I status or the proportion
of students of color. Only 16% of ELD teachers teach in non-Title I schools. Similarly, only 3% of ELD
teachers teach in schools with the fewest students of color, while about 64% teach in schools with the
most students of color. With a student population that is over 9% English language learners, and growing,
greater information and data on ELD teachers is becoming more and more important.
15. Goldin, C., & Katz, L. F. (2007). The race between education and technology: The evolution of U.S. education
wage differentials, 1890 to 2005. Cambridge, MA: National Bureau of Economic Research.
16. OECD. (2016). PISA 2015 Results (Volume I): Excellence and Equity in Education. Paris: PISA, OECD
Publishing.
17. OECD. (2013). Lessons from PISA 2012 for the United States, Strong Performers and Successful Reformers in
Education. OECD Publishing.
18. National Commission on Mathematics and Science Teaching for the 21st Century. (2000). Before It’s Too
Late. Washington, DC: U.S. Department of Education.
LEARNING POLICY INSTITUTE | TEACHER TURNOVER: WHY IT MATTERS AND WHAT WE CAN DO ABOUT IT 44
19. Ingersoll, R. M., & Perda, D. (2010). Is the Supply of Mathematics and Science Teachers Sufcient?
American Educational Research Journal, 47(3), 563–594.
20. Goe, L. (2007). The link between teacher quality and student outcomes: A research synthesis. Washington, DC:
National Comprehensive Center for Teacher Quality; Sadler, P. M., Sonnert, G., Coyle, H. P., Cook-Smith,
N., & Miller, J. L. (2013). The inuence of teachers’ knowledge on student learning in middle school
physical science classrooms. American Educational Research Journal, 50(5), 1020–1049.
21. Kershaw, J. A., & McKean R. N. (1962). Teacher shortages and salary schedules. Santa Monica, CA: RAND
Corporation; Murnane, R. J., & Olsen, R. J. (1990). The effects of salaries and opportunity costs on length
of stay in teaching: Evidence from North Carolina. The Journal of Human Resources, 25(1), 106–124.
22. Ingersoll, R., Merrill, L., & May, H. (2012). Retaining teachers: How preparation matters. Educational
Leadership, 30–34.
23. U.S. Department of Education, National Center for Education Statistics. (2014). Table 204.30: Children
3 to 21 years old served under Individuals with Disabilities Education Act (IDEA), Part B, by type of
disability: Selected years, 1976–77 through 2012–13. In U.S. Department of Education, National Center
for Education Statistics (Ed.), Digest of Education Statistics (2014 ed.). Retrieved from https://nces.ed.gov/
programs/digest/d14/tables/dt14_204.30.asp.
24. U.S. Department of Education, National Center for Education Statistics. (2014). Table 204.30: Children
3 to 21 years old served under Individuals with Disabilities Education Act (IDEA), Part B, by type of
disability: Selected years, 1976–77 through 2012–13. In U.S. Department of Education, National Center
for Education Statistics (Ed.), Digest of Education Statistics (2014 ed.). Retrieved from https://nces.ed.gov/
programs/digest/d14/tables/dt14_204.30.asp.
25. Mcleskey, J., Tyler, N. C., & Flippin, S. S. (2004). The supply of and demand for special education teachers:
A review of research regarding the chronic shortage of special education teachers. The Journal of Special
Education, 38(1), 5–21.
26. Sutcher, L., Darling-Hammond, L., & Carver-Thomas, D. (2016). A coming crisis in teaching? Teacher supply,
demand, and shortages in the U.S. Palo Alto, CA: Learning Policy Institute.
27. Mcleskey, J., Tyler, N. C., & Flippin, S. S. (2004). The supply of and demand for special education teachers:
A review of research regarding the chronic shortage of special education teachers. The Journal of Special
Education, 38(1), 5–21.
28. Simon, N. S., & Johnson, S. M. (2015). Teacher Turnover in High-Poverty Schools: What We Know and Can
Do. Teachers College Record, 117, 1–36.
29. Ingersoll, R. M. 2001. Teacher Turnover and Teacher Shortages: An Organizational Analysis. American
Educational Research Journal, 38(3), 499–534; Borman, G. D., & Dowling, N. M. 2008. Teacher Attrition and
Retention: A Meta-Analytic and Narrative Review of the Research. Review of Educational Research, 78(3),
367–409; Simon, N. S., & Johnson, S. M. 2015. Teacher Turnover in High-Poverty Schools: What We Know
and Can Do. Teachers College Record, 117 (030308), 1–36; Clotfelter, C. T., Ladd, H. F., & Vigdor, J. 2005.
Who Teaches Whom? Race and the Distribution of Novice Teachers. Economics of Education Review, 24(4),
377–92; Hanushek, E. A., Kain, J. F., & Rivkin, S. G. 2004. Why Public Schools Lose Teachers. The Journal of
Human Resources, 39(2), 326–54.
30. Simon, N. S., & Johnson, S. M. (2015). Teacher Turnover in High-Poverty Schools: What We Know and Can
Do. Teachers College Record, 117, 1–36.
31. Ingersoll, R., Merrill, L., & May, H. (2012). Retaining teachers: How preparation matters. Educational
Leadership, 69(8), 30–34.
32. Ingersoll, R. M., & Strong, M. (2011). The Impact of Induction and Mentoring Programs for Beginning
Teachers: A Critical Review of the Research. Review of Educational Research, 81(2), 201–233.
33. Loeb, S., Darling-Hammond, L., & Luczak, J. (2005). How Teaching Conditions Predict Teacher Turnover in
California Schools. Peabody Journal of Education, 80(3), 44–70.
34. Loeb, S., Darling-Hammond, L., & Luczak, J. (2005). How Teaching Conditions Predict Teacher Turnover in
California Schools. Peabody Journal of Education, 80(3), 44–70.
LEARNING POLICY INSTITUTE | TEACHER TURNOVER: WHY IT MATTERS AND WHAT WE CAN DO ABOUT IT 45
35. Goldring, R., Taie, S., & Riddles, M. 2014. Teacher attrition and mobility: Results from the 2012–13 Teacher
Follow-up Survey. National Center for Education Statistics. Washington, DC; Ingersoll, R.M. and May,
H. (2011). Recruitment, Retention and the Minority Teacher Shortage. Consortium for Policy Research in
Education. CPRE Research Report #RR-69.
36. Villegas, A. M., & Irvine, J. J. 2010. Diversifying the Teaching Force: An Examination of Major Arguments.
Urban Review, 42(3), 175–92.
37. Cherng, H. S., & Halpin, P. F. (2016). The importance of minority teachers: Student perceptions of
minority versus white teachers. Educational Researcher, 45(7), 407–420; Cole, B. P. (1986). The black
educator: An endangered species. Journal of Negro Education, 55(3), 326–334; Irvine, J. J. (1988). An
analysis of the problem of the disappearing Black educator. Elementary School Journal, 88(5), 503–514;
Waters, M. M. (1989). An agenda for educating Black teachers. The Educational Forum, 53(3), 267–279;
Gershenson, S., Hart, C. M. D., Lindsay, C. A., & Papageorge, N. W. (2017). The long-run impacts of same-
race teachers. Bonn, Germany: IZA. Institute of Labor Economics.
38. Ingersoll, R.M. and May, H. (2011). Recruitment, Retention and the Minority Teacher Shortage. Consortium
for Policy Research in Education. CPRE Research Report #RR-69.
39. Egalite, A. J., Kisida, B., & Winters, M. A. (2015). Representation in the classroom: The effect of won-race
teachers on student achievement. Economics of Education Review, 45, 44–52; Dee, T. S. (2004). Teachers,
race and student achievement in a randomized experiment. The Review of Economics and Statistics, 86(1),
195–210.
40. Fairclough, A. (2007). A Class of Their Own: Black Teachers in the Segregated South. Cambridge, MA: The
Belknap Press of Harvard University Press.
41. Villegas, A. M., & Irvine, J. J. 2010. Diversifying the Teaching Force: An Examination of Major Arguments.
Urban Review, 42(3), 175–92; Cherng, H. S., Halpin, P. F. (2016). The importance of minority teachers:
Student perceptions of minority versus white teachers. Educational Researcher, 45(7), 407–420; Cole, B. P.
(1986). The black educator: An endangered species. Journal of Negro Education, 55(3), 326–334; Irvine, J.
J. (1988). An analysis of the problem of the disappearing Black educator. Elementary School Journal, 88(5),
503–514; Waters, M. M. (1989). An agenda for educating Black teachers. The Educational Forum, 53(3),
267–279.
42. Sutcher, L., Darling-Hammond, L., & Carver-Thomas, D. (2016). A coming crisis in teaching? Teacher supply,
demand, and shortages in the U.S. Palo Alto, CA: Learning Policy Institute.
43. Goldring, R., Taie, S., & Riddles, M. (2014). Teacher attrition and mobility: Results from the 2012–13 Teacher
Follow-up Survey. Washington, DC: U.S. Department of Education.
44. Executive Ofce of the President (2012). Investing in our future: Returning teachers to the classroom.
Washington, DC: Executive Ofce of the President, https://obamawhitehouse.archives.gov/sites/default/
les/Investing_in_Our_Future_Report.pdf (accessed 2/3/17).
45. Hanushek, E. A., Kain, J. F., & Rivkin, S. G. 2004. Why Public Schools Lose Teachers. The Journal of Human
Resources, 39(2), 326–54. Scadi, B., Sjoquist, D. L., &. Stinebrickner, T. R. 2007. “Race, Poverty, and
Teacher Mobility.” Economics of Education Review, 26(2), 145–59.
46. Allensworth, E., Ponisciak, S., & Mazzeo, C. 2009. The Schools Teachers Leave: Teacher Mobility in
Chicago Public Schools. Consortium on Chicago School Research. Chicago, IL; Boyd, D., Grossman, P.,
Ing, M., Lankford, H., Loeb, S., & Wyckoff, J. 2011. The Inuence of School Administrators on Teacher
Retention Decisions. American Educational Research Journal, 48(2), 303–33; Loeb, S., Darling-Hammond,
L., & Luczak, J. 2005. How Teaching Conditions Predict Teacher Turnover in California Schools. Peabody
Journal of Education, 80(3), 44–70; Johnson, S. M., Kraft, M. A., & Papay, J. P. 2012. How Context Matters
in High-Need Schools: The Effects of Teachers’ Working Conditions on Their Professional Satisfaction
and Their Students’ Achievement. Teachers College Record, 114 (100306), 1–39; Ladd, H. F. 2011. Teachers’
Perceptions of Their Working Conditions: How Predictive of Planned and Actual Teacher Movement?
Educational Evaluation and Policy Analysis, 33(2), 235–61; Marinell, W. H., & Coca, V. M. 2013. Who Stays
and Who Leaves? Findings from a Three-Part Study of Teacher Turnover in NYC Middle Schools. New
York: The Research Alliance for New York City Schools.
47. Goldring, R., Taie, S., Rizzo, L., Colby, D., & Fraser, A. (2013). User’s Manual for the 2011–12 Schools and
Stafng Survey Volume 6: Public and Private School Teacher Data Files (NCES 2013–335). U.S. Department of
LEARNING POLICY INSTITUTE | TEACHER TURNOVER: WHY IT MATTERS AND WHAT WE CAN DO ABOUT IT 46
Education. Washington, DC: National Center for Education Statistics. Retrieved from http://nces.ed.gov/
pubsearch.
48. Ingersoll, R., Merrill, L., & May, H. (2014). What are the effects of teacher education and preparation on
beginning teacher attrition? Research Report (#RR-82). Philadelphia: Consortium for Policy Research in
Education, University of Pennsylvania; Henke, R., Chen, X., & Geis, S. (2000). Progress through the Teacher
Pipeline: 1992–93 College Graduates and Elementary/Secondary School Teaching as of 1997. Postsecondary
Education Descriptive Analysis Report. U.S. Department of Education. Washington, DC: National Center
for Education Statistics.
49. Podolsky, A., & Kini, T. (2016). How effective are loan forgiveness and service scholarships for recruiting
teachers? (policy brief). Palo Alto, CA: Learning Policy Institute.
50. Baugh, W. H., & Stone, J. A. (1982). Mobility and Wage Equilibration in the Educator Labor Market.
Economics of Education Review, 2(3), 253–274; Murnane, R. J., & Olsen, R. J. (1990). The effects of salaries
and opportunity costs on length of stay in teaching: Evidence from North Carolina. The Journal of Human
Resources, 25(1), 106–124; Loeb, S., Darling-Hammond, L., & Luczak, J. (2005). How Teaching Conditions
Predict Teacher Turnover in California Schools. Peabody Journal of Education, 80(3), 44–70; Ondrich, J.,
Pas, E., & Yinger, J. (2008). The determinants of teacher attrition in upstate New York. Public Finance
Review, 36(1), 112–144.
51. Gray, L., & Taie, S. (2015). Public school teacher attrition and mobility in the rst ve years: Results from the
rst through fth waves of the 2007–08 Beginning Teacher Longitudinal Study. U.S. Department of Education.
Washington, DC: National Center for Education Statistics.
52. For a comprehensive review, see Simon, N. S., & Johnson, S. M. (2015). Teacher turnover in high-poverty
schools: What we know and can do. Teachers College Record 117(030308), 1–36; See also Borman, G. D.,
& Dowling, N. M. (2008). Teacher attrition and retention: A meta-analytic and narrative review of the
research. Review of Educational Research, 78(3), 367–409; Loeb, S., Darling-Hammond, L., & Luczak, J.
(2005). How Teaching Conditions Predict Teacher Turnover in California Schools. Peabody Journal of
Education, 80(3), 44–70.
53. Simon, N. S., & Johnson, S. M. 2015. “Teacher turnover in high-poverty schools: What we know and can
do.” Teachers College Record 117(030308), 1–36
54. Grissom, J. A. (2011). Can Good Principals Keep Teachers in Disadvantaged Schools? Linking Principal
Effectiveness to Teacher Satisfaction and Turnover in Hard-to-Staff Environments. Teachers College
Record, 113(11), 2552–2585. See also Podolsky, A., Kini, T., Bishop, J., & Darling-Hammond, L. (2016).
Solving the teacher shortage: How to attract and retain excellent educators. Palo Alto, CA: Learning Policy
Institute.
55. Podolsky, A., Kini, T., Bishop, J., & Darling-Hammond, L. (2016). Solving the teacher shortage: How to
attract and retain excellent educators. Palo Alto, CA: Learning Policy Institute.
56. Sutcher, L., Darling-Hammond, L., & Carver-Thomas, D. (2016). A coming crisis in teaching? Teacher supply,
demand, and shortages in the U.S. Palo Alto, CA: Learning Policy Institute.
57. Eger, A. (2015, September 21). Teachers struggle with low pay, working conditions: Teachers turn to extra
jobs, soup kitchens to get by. Tulsa World.
58. Boser, U., & Straus, C. (2014). Mid- and late-career teachers struggle with paltry incomes. Washington, DC:
Center for American Progress.
59. Greenstone, M., & Looney, A. (2013). Rising student debt burdens: Factors behind the phenomenon.
Washington, DC: The Hamilton Project, The Brookings Institution.
60. Podolsky, A. & Kini, T. (2016). How effective are loan forgiveness and service scholarships for recruiting
teachers? (policy brief). Palo Alto, CA: Learning Policy Institute.
61. Wiswall, M. (2013). The dynamics of teacher quality. Journal of Public Economics, 100, 61–78.
62. Boston Teacher Residency. (2016). “The BTR Impact.” Retrieved from http://www.bpe.org/boston-teacher-
residency/about/impact; National Center for Teacher Residencies. (2016). 2015 Network Impact Overview.
Chicago; Guha, R., Hyler, M., & Darling-Hammond, L. (2016). Teacher residencies: Building a high-quality,
sustainable workforce. Palo Alto, CA: Learning Policy Institute; Solomon, J. (2009). The Boston Teacher
Residency: District-Based Teacher Education. Journal of Teacher Education, 60(5), 478–488.
LEARNING POLICY INSTITUTE | TEACHER TURNOVER: WHY IT MATTERS AND WHAT WE CAN DO ABOUT IT 47
63. Commission on Teacher Credentialing, California School Paraprofessional Teacher Training Program.
An Annual Report to the Legislature as Required by SB 1636 (Sacramento, CA: Author, 2008), accessed
August 10, 2016, http://www.ctc.ca.gov/reports/PTTP_2008_LegRpt.pdf; Podolsky, A., Kini, T., Bishop, J.,
& Darling-Hammond, L. (2016). Solving the teacher shortage: How to attract and retain excellent educators.
Palo Alto, CA: Learning Policy Institute.
64. Picucci, A. (2016, May 13). Early results are in: NTC model leads to student learning [Web log].
Retrieved from https://newteachercenter.org/blog/2016/05/13/early-results-ntc-model-leads-
student-learning/; Picucci, A. (2016, August 10). New i3 research shows student achievement gains
continue with NTC support [Web log]. Retrieved from https://newteachercenter.org/blog/2016/08/10/
new-i3-research-shows-student-achievement-gains-continue-with-ntc-support/.
65. Darling-Hammond, L., LaPointe, M., Meyerson, D., Orr. M. T., & Cohen, C. (2007). Preparing School Leaders
for a Changing World: Lessons from Exemplary Leadership Development Programs. Stanford, CA: Stanford
University, Stanford Educational Leadership Institute; Sutcher, L., Podolsky, A., & Espinoza, D. (2017).
Supporting principals’ learning: Key features of effective programs. Palo Alto, CA: Learning Policy Institute.
66. NCES Handbook of Survey Methods: SASS Teacher Follow-Up Survey (TFS), October (2015): 1–6. https://
nces.ed.gov/surveys/sass/.
67. Ingersoll, R.M. and May, H. (2011). Recruitment, Retention and the Minority Teacher Shortage. Consortium
for Policy Research in Education. CPRE Research Report #RR-69.
68. Taylor, L. L., & Glander, M. (2006). Documentation for the NCES Comparable Wage Index Data File (EFSC
2006–865). U.S. Department of Education. Washington, DC: National Center for Education Statistics.
LEARNING POLICY INSTITUTE | TEACHER TURNOVER: WHY IT MATTERS AND WHAT WE CAN DO ABOUT IT 48
About the Authors
Desiree Carver-Thomas is a Research and Policy Associate on LPI’s Educator Quality Team.
She is the lead author of Addressing California’s Growing Teacher Shortage: 2017 Update and is
the co-author of A Coming Crisis in Teaching? Teacher Supply, Demand, and Shortages in the U.S.
Previously, she taught in New York City public schools, and consulted on strategies for diverting
recidivism and implementing a full-service community schools initiative.
Linda Darling-Hammond is President of the Learning Policy Institute and Charles E. Ducommun
Professor of Education Emeritus at Stanford University. She has conducted extensive research on
issues of educator supply, demand, and quality. Among her award-winning publications in this area
are What Matters Most: Teaching for America’s Future; Teaching as the Learning Profession; Powerful
Teacher Education; and Preparing Teachers for a Changing World: What Teachers Should Learn and Be
Able to Do.

1530 Page Mill Road, Suite 200
Palo Alto, CA 94304
p: 650.332.9797
1301 Connecticut Avenue NW, Suite 500
Washington, DC 20036
p: 202.830.0079
@LPI_Learning | learningpolicyinstitute.org
The Learning Policy Institute conducts and communicates independent, high-quality research to improve education
policy and practice. Working with policymakers, researchers, educators, community groups, and others, the Institute
seeks to advance evidence-based policies that support empowering and equitable learning for each and every child.
Nonprofit and nonpartisan, the Institute connects policymakers and stakeholders at the local, state, and federal
levels with the evidence, ideas, and actions needed to strengthen the education system from preschool through
college and career readiness.
