LCFF Budget Overview for Parents
Page 1 of
Local Educational Agency (LEA) Name: W.E.B. DuBois Public Charter School
CDS Code: 10767781030774
School Year: 2022 – 23
LEA contact information: Dr. Linda Scott; lscott@agapeschools.org; T: 559. 230.3072
School districts receive funding from different sources: state funds under the Local Control Funding
Formula (LCFF), other state funds, local funds, and federal funds. LCFF funds include a base level of
funding for all LEAs and extra funding - called "supplemental and concentration" grants - to LEAs based
on the enrollment of high needs students (foster youth, English learners, and low-income students).
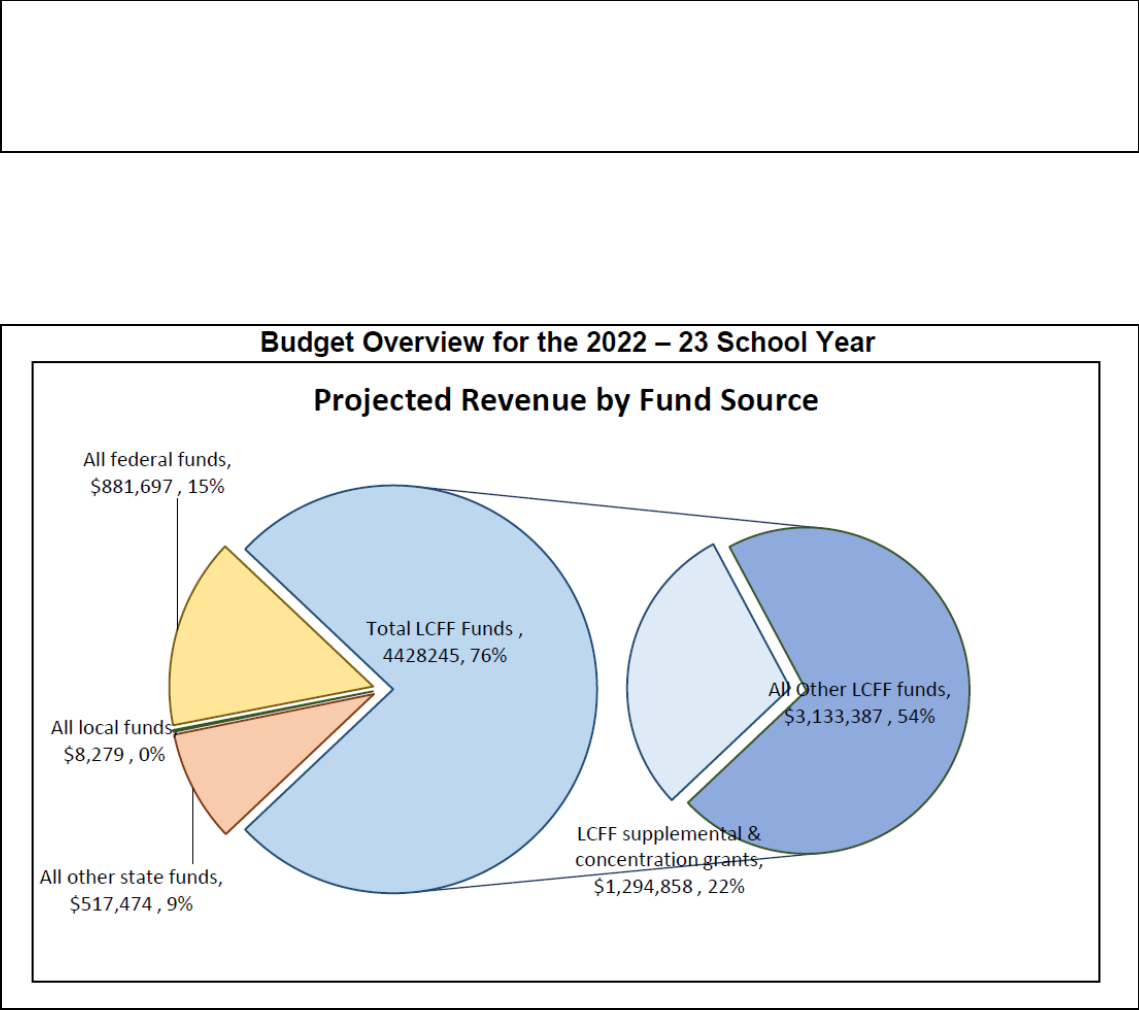
This chart shows the total general purpose revenue W.E.B. DuBois Public Charter School expects to
receive in the coming year from all sources.
The text description for the above chart is as follows: The total revenue projected for W.E.B. DuBois
Public Charter School is $5,835,695.00, of which $4,428,245.00 is Local Control Funding Formula
(LCFF), $517,474.00 is other state funds, $8,279.00 is local funds, and $881,697.00 is federal funds. Of
the $4,428,245.00 in LCFF Funds, $1,294,858.00 is generated based on the enrollment of high needs
students (foster youth, English learner, and low-income students).

LCFF Budget Overview for Parents
Page 2 of
The LCFF gives school districts more flexibility in deciding how to use state funds. In exchange, school
districts must work with parents, educators, students, and the community to develop a Local Control and
Accountability Plan (LCAP) that shows how they will use these funds to serve students.
Budgeted Expenditures in the LCAP
$ 6,000,000
$ 5,000,000
$ 4,000,000
$ 3,000,000
$ 2,000,000
$ 1,000,000
$ 0
This chart provides a quick summary of how much W.E.B. DuBois Public Charter School plans to spend
for 2022 – 23. It shows how much of the total is tied to planned actions and services in the LCAP.
The text description of the above chart is as follows: W.E.B. DuBois Public Charter School plans to spend
$5,576,698.00 for the 2022 – 23 school year. Of that amount, $5,576,698.00 is tied to actions/services in
the LCAP and $0.00 is not included in the LCAP. The budgeted expenditures that are not included in the
LCAP will be used for the following:
The 8 goals in the LCAP have $5,597,229 in planned expenditures out of a grand total of $5,597,229 in
general fund expenditures. The $8,913 not in the LCAP is the general fund contribution to the cafeteria
fund to meet the projected costs of the program that aren't funded by state and federal grants.
Increased or Improved Services for High Needs Students in the LCAP for the 2022 – 23
School Year
In 2022 – 23, W.E.B. DuBois Public Charter School is projecting it will receive $1,294,858.00 based on
the enrollment of foster youth, English learner, and low-income students. W.E.B. DuBois Public Charter
School must describe how it intends to increase or improve services for high needs students in the LCAP.
W.E.B. DuBois Public Charter School plans to spend $1,294,858.00 towards meeting this requirement, as
described in the LCAP.
Total Budgeted
General Fund
Expenditures,
$5,576,698
Total Budgeted
Expenditures in
the LCAP
$5,576,698

Local Control and Accountability Plan Template Page 1 of 7
Update on Increased or Improved Services for High Needs Students in 2021 – 22
This chart compares what W.E.B. DuBois Public Charter School budgeted last year in the LCAP for actions and services that contribute to
increasing or improving services for high needs students with what
W.E.B. DuBois Public Charter School estimates it has spent on actions and services that contribute to increasing or improving services for
high needs students in the current year.
The text description of the above chart is as follows: In 2021 – 22, W.E.B. DuBois Public Charter School's LCAP budgeted $1,237,986.00 for
planned actions to increase or improve services for high needs students. W.E.B. DuBois Public Charter School actually spent $1,303,599.00
for actions to increase or improve services for high needs students in 2021 – 22.
Prior Year Expenditures: Increased or Improved Services for High Needs
Students
Total Budgeted Expenditures for
High Needs Students in the LCAP
$1,237,986
Actual Expenditures for High
Needs Students in LCAP
$1,303,599
$ 0
$ 200,000 $ 400,000 $ 600,000 $ 800,000 $ 1,000,000 $ 1,200,000 $ 1,400,000

2021–22 LCAP Supplement W.E.B DuBois Public Charter School
Page 1 of 5
Prompt 1: A description of how and when the LEA engaged, or plans to engage, its educational partners on the use of funds provided
through the Budget Act of 2021 that were not included in the 2021–22 Local Control and Accountability Plan (LCAP).
•
•
•
•
Concentration Grant Additional 15% Funding: $89,611
Educator Effectiveness Grant: $99,048
Expanded Learning Opportunity Program: $88,768
A-G Completion Improvement Grant: $150,000
Our Charter will engage all Stakeholders through School Site Council (SSC), English Language Advisory Committee (ELAC),
Career Technical Education Advisory Boards, Parent Advisory meetings and Community Informational forums. All Stake Holders
will review outlined plans and Budgetary data along with the Schools’ progress year to date. All Stake holders will be provided the
opportunity to consider our plans and provide input through Public hearings and Student/Parent Surveys.
Previous engagement opportunities include:
Local Control and Accountability Plan 2021-2022 https://www.agapeschools.org/lcap.html
Supplement to the Annual Update to the 2021–22 Local Control and
Accountability Plan
Local Educational Agency (LEA) Name
Contact Name and Title
Email and Phone
W.E.B DuBois Public Charter School
Dr. Linda Scott, CEO
lscott@agapeschools.org
559. 486.1199
California’s 2021–22 Budget Act, the federal American Rescue Plan Act of 2021, and other state and federal relief acts have provided
local educational agencies (LEAs) with a significant increase in funding to support students, teachers, staff, and their communities in
recovering from the COVID-19 pandemic and to address the impacts of distance learning on students. The following is a one-time mid-
year report to the local governing board or body and educational partners related to engagement on, and implementation of, these Acts.

2021–22 LCAP Supplement W.E.B DuBois Public Charter School
Page 2 of 5
W.E.B DuBois Public Charter School has an enrollment of 333 (CALPADS) unduplicated student group count which is greater
than 55%. As a result, our Charter has increased the number of staff funded to concentration Grant funds. We have hired
an additional Guidance Counselor and 3 Instructional Aides. Our Counselor provides direct services to all students
including low income, English Learners and Foster Youth. Services includes Social and emotional Counseling, Academic
Guidance, school to Career transition, and evaluation of A-G requirements for each student. These Services have been
Increased from the previous year. Additionally, we have hired Credentialed Substitute Teachers and Instructional Aides to
assist in Math and Reading Intervention Services for all students. This is to improve and decrease the number of learning
losses experienced by our students.
Prompt 2: A description of how the LEA used, or plans to use, the additional concentration grant add-on funding it received to increase
the number of staff who provide direct services to students on school campuses with an enrollment of students who are low-income,
English learners, and/or foster youth that is greater than 55 percent.

2021–22 LCAP Supplement W.E.B DuBois Public Charter School
Page 3 of 5
W.E.B DuBois Public Charter School has a long-established foundational principle of meaningful educational partner engagement.
These efforts were refined and improved through the Local Control and Accountability Plan (LCAP) development process. The
district’s practices have been further enhanced during the pandemic as ABC District sought the input and feedback of its
educational partner groups from the onset of the pandemic and continuing through the development of the Learning Continuity and
Attendance Plan, the 2021-2022 LCAP, Expanded Learning Opportunities Grant and the ESSER III Expenditure Plan.
The following links and page numbers indicate how and when the LEA engaged its education partners in the use of funds received
to support recovery for the COVID- 19 Pandemic.
• Learning Continuity and Attendance Plan https://www.agapeschools.org/learning-continuity-and-attendance-plan.html
• Expanded Learning Opportunities Grant Plan https://www.agapeschools.org/expanded-learning-opportunities-grant-plan.html
• Local Control and Accountability Plan https://www.agapeschools.org/lcap.html
• ESSER III Expenditure Plan https://www.agapeschools.org/esser-iii-expenditure-plan.html
• A-G Completion Improvement Grant https://www.agapeschools.org/a-g-completion-improvement-grant-plan.html
Prompt 3: A description of how and when the LEA engaged its educational partners on the use of one-time federal funds received that
are intended to support recovery from the COVID-19 pandemic and the impacts of distance learning on pupils.

2021–22 LCAP Supplement W.E.B DuBois Public Charter School
Page 4 of 5
Our Charter, has expanded Federal school Emergency Relief Funds on the following items below, in an effort our Students and Staff
safe and recover Learning Losses experienced by the Pandemic.
ESSER III Safe Return to In-Person Instruction & Continuity of Services Plan
The majority of Emergency Relief funds have been utilized to prepare and implement a transition in In-person learning. The following
obstacles we were able to overcome in 2020 Fiscal Year due to the assistance the federal American Rescue Plan Act provided:
• Reorganizing the functioning of the school from in person learning too fully online.
• Ensuring the safety of staff through PPE materials and 6-foot distancing.
• Ensuring internet was provided to our student’s homes within a 60-day period.
• Moving from a 2 to 1 Computer device to student ratio to a 1 to 1 ratio.
• Leveraging the funding to accomplish the goal of purchasing a mass amount of technology devices.
• Purchasing a platform and developing training for teachers and administration to instruct students on the zoom online platform.
• Keeping parents informed though a online platform.
• Set up a telehealth strategy to deliver mental health counseling.
• Helping and assisting parents with food and resources including delivery to homes.
In the 2020-21 school year our school face the challenge of ensuring students with the highest needs were able to return safely for
school. We successfully were able to provide:
• Transportation with limited seating and multiple trips.
• Ensure the safety of Students and staff onsite together with high tech equipment and redesigned classroom setups.
• Continuing the transition of online learning and Professional Develop for staff.
ESSER III Safe Return to In-Person Instruction & Continuity of Services Plan
In the current school year of 2021-2022 the most significant challenges we still face is:
• Engaging students back to classroom learning and delivering instruction to online learning.
• Staff shortages due to COVID 19
• Covid tracing which has required additional training and hired Medical Assistance.
• Locating substitute teachers to cover classroom vacancies or staff shortages due to illness.
• Student attendance has decrease by 8%.
Prompt 4: A description of how the LEA is implementing the federal American Rescue Plan Act and federal Elementary and Secondary
School Emergency Relief expenditure plan, and the successes and challenges experienced during implementation.

2021–22 LCAP Supplement W.E.B DuBois Public Charter School
Page 5 of 5
Safe Return to In-Person Instruction and Continuity of Services Plan
W.E.B. DuBois Public Charter School used its fiscal resources to implement the requirements of the Safe Return to In-Person
Instruction and Continuity of Services Plan by purchasing Personal Protective Equipment (PPE), Cleaning and sanitation, 1:1
Technology devices, hiring Instructional aids, additional counselors, mental health resources, and Professional Development.
The implementation of these additional funds received in the 2021-2022 school year are specifically aligned to the LCAP by
ensuring school could progress towards each one of its goals outlined in the LCAP.
ESSER III Expenditure Plan
• Strategies for Continuous and Safe In-Person Learning: $676,799
• Addressing Lost Instructional Time: $434,458
• In-Person Instructional & Targeted Intervention: $676,799
• Pupil Learning Loss: $348,124
• Conditions and Climate: $86,334
W.E.B DuBois Public Charter School used its fiscal resources to implement the requirements of the ESSER III Expenditure Plan
by doing the following
1) Contracted Mental Health and School guidance counselors’ check-ins 2) Social Emotional Check-ins 3) Student Attendance
Tracking
4) After- school Program 5) ISGI Check-ins 6) Food services 7) Monthly Newsletters 8) Principal Messages 9) Teacher to Student
check-ins
10) EL Program – ELD scheduling 11) PBIS/MTSS Implementations 12) Foster and Homeless check-ins 1:1 13) Student Ratio –
Chromebooks,
Tablets and Desktops 14) Help desk Teaching and Learning 15) Classroom Observation 16) PLC Supplement Materials Credit
Recovery 17) Flex
Scheduling 18) COVID-19 PPE 19) HVAC Infrastructure
Prompt 5: A description of how the LEA is using its fiscal resources received for the 2021–22 school year in a manner that is consistent
with the applicable plans and is aligned with the LEA’s 2021–22 LCAP and Annual Update.

2021–22 LCAP Supplement Instructions
Page 1 of 4
W.E.B. DuBois Public Charter School
LCAP GOALS - Mid Year Budgeted Expenditures
Goal(G)/Actio
n(A)
Action Item Details
Budgeted
Expenditures
Actuals (1st
interim)
Difference
Progress To Date
GOAL 1:
W.E.B. DuBois Public Charter School will increase student proficiency in English Language Arts and Math
G1:A1
Intervention
1,130,284
2,118,183
987,899
The school is budgeting additional monies to help students transistion back to in-person learning and
help those students who aren't meeting educational standards identified utilizing assessment data
G1:A2
Recruit High Quality Teachers
202,245
291,856
89,611
Increase in budget due to a 15% increase in concentration grant funds
GOAL 2:
Long-Term English Language Learners will progress towards English Language Proficiency each year
G2:A1
English Language Learners
Instructional
Strategies
641,187
641,187
-
No material change to the approved plan
GOAL 3:
Our school will ensure our teachers are equipped with training, materials, support, and technology to implement the California Common Core Standards
G3:A1
Teacher Professional
Development
207,306
306,354
99,048
Increase budget due to Educator Effectiveness Grant
GOAL 4:
Our school will increase parent participation in shared governance through trainings, Parent Advisory Council, ELAC, and Feedback Collection Initiatives.
G4:A1
Increase Parent Involvement
23,751
23,751
-
No material change to the approved plan
GOAL 5:
Our school will maintain safe and clean facilities that promote learning with instructional support such as computer labs, online libraries, on-site libraries, sports,
summer enrichment, and after-school programs.
G5:A1
Safe High Quality Facilities
982,543
982,543
-
No material change to the approved plan
GOAL 6:
Our school will maintain a minimum of 90% attendance rate for ASAM students.
G6:A1
Increase Attendance & Lower
Dropout Rates
88,883
338,883
250,000
Due to the pandemic situation and other factors, the school is budgeting additional monies to deal with
increaseing attendance and dropout rates.
GOAL 7:
All students will have access to Career Pathways, Advanced Placement, and College Preparatory Course Options.
G7:A1
Implement Dual
Credit
Partnerships
154,624
154,624
-
No material change to the approved plan
G7:A2
Increase Opportunities for
Career Pathways Students
145,351
145,351
-
No material change to the approved plan
G7:A3
Professional Development of
Teachers
3,800
3,800
-
No material change to the approved plan
GOAL 8:
Students in our special education populations will make satisfactory progress towards H.S. graduation requirements.
G8:A1
Base: Special Education
428,093
428,093
-
No material change to the approved plan
G8:A2
Foster/Homeless
Liason
149,800
149,800
-
No material change to the approved plan
GRAND TOTAL:
4,157,867
5,584,425
1,426,558

2021–22 LCAP Supplement Instructions
Page 2 of 4
Introduction
For additional questions or technical assistance related to the completion of the Supplement to the Annual Update to the 2021–22 Local
Control and Accountability Plan (LCAP), please contact the local county office of education (COE), or the California Department of
Education’s (CDE’s) Local Agency Systems Support Office, by phone at 916-319-0809 or by email at [email protected].
California’s 2021–22 Budget Act, the federal American Rescue Plan Act of 2021, and other state and federal relief acts have provided
local educational agencies (LEAs) with a significant increase in funding to support students, teachers, staff, and their communities in
recovering from the COVID-19 pandemic and to address the impacts of distance learning on students. Section 124(e) of Assembly Bill
130 requires LEAs to present an update on the Annual Update to the 2021–22 LCAP and Budget Overview for Parents on or before
February 28, 2022, at a regularly scheduled meeting of the governing board or body of the LEA. At this meeting, the LEA must include
all of the following:
• The Supplement to the Annual Update for the 2021–22 LCAP (2021–22 Supplement);
• All available mid-year outcome data related to metrics identified in the 2021–22 LCAP; and
• Mid-year expenditure and implementation data on all actions identified in the 2021–22 LCAP.
When reporting available mid-year outcome, expenditure, and implementation data, LEAs have flexibility to provide this information as
best suits the local context, provided that it is succinct and contains a level of detail that is meaningful and accessible for the LEA’s
educational partners.
The 2021–22 Supplement is considered part of the 2022–23 LCAP for the purposes of adoption, review, and approval, and must be
included with the LCAP as follows:
• The 2022–23 Budget Overview for Parents
• The 2021–22 Supplement
• The 2022–23 LCAP
• The Action Tables for the 2022–23 LCAP
• The Instructions for the LCAP Template
As such, the 2021–22 Supplement will be submitted for review and approval as part of the LEA’s 2022–23 LCAP.
Instructions for the Supplement to the Annual Update for the 2021–22 Local Control
and Accountability Plan Year

2021–22 LCAP Supplement Instructions
Page 3 of 4
Respond to the following prompts, as required. In responding to these prompts, LEAs must, to the greatest extent practicable, provide
succinct responses that contain a level of detail that will be meaningful and accessible for the LEA’s educational partners and the
broader public and must, to the greatest extent practicable, use language that is understandable and accessible to parents.
In responding to these prompts, the LEA has flexibility to reference information provided in other planning documents. An LEA that
chooses to reference information provided in other planning documents must identify the plan(s) being referenced, where the plan(s)
are located (such as a link to a web page), and where in the plan the information being referenced may be found.
Prompt 1: “A description of how and when the LEA engaged, or plans to engage, its educational partners on the use of funds provided
through the Budget Act of 2021 that were not included in the 2020–21 Local Control and Accountability Plan (LCAP).”
In general, LEAs have flexibility in deciding what funds are included in the LCAP and to what extent those funds are included. If the LEA
received funding through the Budget Act of 2021 that it would have typically included within its LCAP, identify the funds provided in the
Budget Act of 2021 that were not included in the LCAP and provide a description of how the LEA has engaged its educational partners
on the use of funds. If an LEA included the applicable funds in its adopted 2021–22 LCAP, provide this explanation.
Prompt 2: “A description of how LEA used, or plans to use, the concentration grant add-on funding it received to increase the number
of staff who provide direct services to students on school campuses with an enrollment of students who are low-income, English
learners, and/or foster youth that is greater than 55 percent.”
If LEA does not receive a concentration grant or the concentration grant add-on, provide this explanation.
Describe how the LEA is using, or plans to use, the concentration grant add-on funds received consistent with California Education
Code Section 42238.02, as amended, to increase the number of certificated staff, classified staff, or both, including custodial staff, who
provide direct services to students on school campuses with greater than 55 percent unduplicated pupil enrollment, as compared to
schools with an enrollment of unduplicated students that is equal to or less than 55 percent.
In the event that the additional concentration grant add-on is not sufficient to increase the number of staff providing direct services to
students at a school with an enrollment of unduplicated students that is greater than 55 percent, describe how the LEA is using the
funds to retain staff providing direct services to students at a school with an enrollment of unduplicated students that is greater than 55
percent.
Prompt 3: “A description of how and when the LEA engaged its educational partners on the use of one-time federal funds received that
are intended to support recovery from the COVID-19 pandemic and the impacts of distance learning on pupils.”
Instructions

2021–22 LCAP Supplement Instructions
Page 4 of 4
If the LEA did not receive one-time federal funding to support recovery from the COVID-19 pandemic and the impacts of distance
learning on students, provide this explanation.
Describe how and when the LEA engaged its educational partners on the use of one-time federal funds it received that are intended to
support recovery from the COVID-19 pandemic and the impacts of distance learning on students. See the COVID-19 Relief Funding
Summary Sheet web page (https://www.cde.ca.gov/fg/cr/relieffunds.asp) for a listing of COVID-19 relief funding and the Federal
Stimulus Funding web page (https://www.cde.ca.gov/fg/cr/) for additional information on these funds. The LEA is not required to
describe engagement that has taken place related to state funds.
Prompt 4: “A description of how the LEA is implementing the federal American Rescue Plan Act and federal Elementary and
Secondary School Emergency Relief expenditure plan, and the successes and challenges experienced during implementation.”
If an LEA does not receive ESSER III funding, provide this explanation.
Describe the LEA’s implementation of its efforts to maintain the health and safety of students, educators, and other staff and ensure the
continuity of services, as required by the federal American Rescue Plan Act of 2021, and its implementation of the federal Elementary
and Secondary School Emergency Relief (ESSER) expenditure plan to date, including successes and challenges.
Prompt 5: “A description of how the LEA is using its fiscal resources received for the 2021–22 school year in a manner that is
consistent with the applicable plans and is aligned with the LEA’s 2021–22 LCAP and Annual Update.”
Summarize how the LEA is using its fiscal resources received for the 2021–22 school year to implement the requirements of applicable
plans in a manner that is aligned with the LEA’s 2021–22 LCAP. For purposes of responding to this prompt, “applicable plans” include
the Safe Return to In-Person Instruction and Continuity of Services Plan and the ESSER III Expenditure Plan.
California Department of Education
November 2021
Local Control and Accountability Plan Template Page 2 of 7
Local Control and Accountability Plan
The instructions for completing the Local Control and Accountability Plan (LCAP) follow the template.
Local Educational Agency (LEA) Name
Contact Name and Title
Email and Phone
W.E.B. DuBois Public Charter School
Dr. Linda Scott CEO
lscott@agapeschools.org 559-486-1166
Plan Summary [LCAP Year]
General Information
A description of the LEA, its schools, and its students in grades transitional kindergarten–12, as applicable to the LEA.
W.E.B. DuBois Public Charter School has been an asset to the community for 23 years. Our expanding diverse population includes students
who meet one or more “high needs” indicators. These indicators include students who are habitually truant, have dropped out of school, are
pregnant or parenting, retained in one grade level and suspended or expelled within the school’s eligible criteria for enrollment. The following
represents the most recent factors that qualify our schools for the Alternative Schools Accountability Model:
95% of our students qualify for Free and Reduced Meals and are living below poverty levels. The existing demographics of W.E.B. DuBois
are displayed below:
W.E. B. DuBois Public Charter School DASS Qualifier 0.0% Expelled, 2% Suspended, 1% Wards of the Court, 2% Pregnant and/or
Parenting 1% Recovered Dropout, 30% Habitually Truant, 5% Retained More Than Once in kindergarten through grade eight 75% Total
DASS Students
W.E.B. DuBois Public Charter School has enrollment is 337 and the 2021-22 student population is American Indian 1%, African American
19.83%, Asian 1.44%, Hispanic 76.44%, Caucasian 1.44%, Other1%. 96% of students are identified as socioeconomically
disadvantaged,12% of students are identified as students with disabilities and 29% are identified as English language learners.
Reflections: Successes
A description of successes and/or progress based on a review of the California School Dashboard (Dashboard) and local data.
GREATEST PROGRESS
W.E.B DuBois has reviewed its achievement outcomes within the DASS Board, Data Quest, and Local assessments the following success
have been evaluated and outlined within our WASC Report, and LCAP Plan:
On the SBAC 2018-2019, ELA assessment in regard to students meeting/exceeding standards from last year, there was a 7.04% increase in
the 3rd grade, 37.5% increase in 4th grade, 14.77% increase in 5th grade, 21.25% increase in 8th grade, and a 4.33% increase in 11th
grade.

Local Control and Accountability Plan Template Page 3 of 7
19-20 SBAC Suspended by the state due COVID 19.
W.E.B DuBois Graduation Rate has increased in all areas with Socioeconomic disadvantage students displaying the highest increase from
87.9% to 96%, Hispanic Student increased from 93.8% to 95.7%. The overall 5-year cohort graduation rate increased from 64% to 74.3%.
• On the SBAC 2018-2019, Math assessment regarding students meeting/exceeding standards, there was a 20.61% increase in the 4th
grade, 0.5% increase in the 6th grade, 9.89% increase in the seventh grade, 29% increase in the eighth grade, and a 2% increase in the
11th grade. 19-20 SBAC Suspended by the state due COVID 19.
• The percentage of chronically absent students declined by 11.41%.
• W.E.B. DuBois’s suspension rate has decreased from 1.2% to 0.03%, this is due to the restructuring of the schools Core Values,
Positive Behavioral Interventions Strategies, and the new Support Tier Interventions Program.
• The school received a six-year WASC Accredited until June 30, 2025.
• Our school received Board Charter Renewal approval from Washington Unified School District until June 30, 2025
• The school has fully implemented 3 pathways and students have accomplished meeting the Career Pathway and CTE requirements
prior to graduation.
• Students are provided opportunity to complete a dual enrollment college credit program and earn a college degree or certificate while
earning their high school diploma.
• The school has developed over 50 intern partnerships to expand job shadowing and internship opportunities.
• Parent surveys express over 90% satisfaction with facilities, curriculum, and safety.
• The school has small classroom sizes this helps students to collaborate and learn through differentiated instruction.
• We have increased the number of highly qualified teachers compared to the prior year.
• The school has implemented standards-based curriculum and has incorporated blended learning.
• Students have opportunities to apply content/skills learned in career track classes
• W.E.B. DuBois has established Career Pathway programs that provides many career readiness opportunities for students.
• W.E.B. DuBois has well established business partnerships.
• Multi-Tiered System of Supports that provides personalized services in academic, college and career, and social and emotional
domains.
• DuBois has developed a literacy program though are Monthly Read-A-Thon the participation has increased each month with parent,
community, and student participation. Students receive free books each month in grades Tk-3rd to increase reading literacy.

Local Control and Accountability Plan Template Page 4 of 7
Reflections: Identified Need
A description of any areas that need significant improvement based on a review of Dashboard and local data, including any areas of low
performance and significant performance gaps among student groups on Dashboard indicators, and any steps taken to address those areas.
W.E.B. DuBois Charter School has identified major areas of deficiency by completing a needs assessment, reviewing DASSboard, local data
and by obtaining feedback from stakeholders including parents, students and community advisory meetings. We have also reviewed our
needs based on state and local performance indicators within the prior LCAP. We strive to be a charter of academic excellence by providing
supportive and responsive leadership with system wide approaches, and culturally competent initiatives that ensure that all students are
college and career ready. The charter will continue to address areas of improvement by: (1) Refining our staff Leadership training to expand
student engagement strategies and the use of formative assessment reviews to ensure the monitoring of student performance measures and
metrics performance outcomes outlined within LCAP, (2) Increase the number of activities and educational trips for students related to in
classroom lessons (3) support teacher collaborative teams in using data to improve English Learner results in speaking, writing, reading and
listening by providing new approaches, and (4) provide real time coaching opportunities for teachers in data analysis and effective
instructional techniques, (5) Improve student attendance to increase student performance and students at school, and (6) Expand the use of
facilities along with visual appearance and safety measures (7) Increase the number of Career Pathways, AP classes offered and job
shadowing and internship opportunities, and (8) Increase the number of students in special populations graduating from high school including
foster youth, students with disabilities and EL students. Staff have and will continue to analyze student performance data through site plans,
professional development, DASSboard data, collaboratively during PLC’s. The LEA has designed a plan to create targeted tier interventions
within cohorts to better address the academic and social-emotional needs of students. W.E.B. DuBois Charter School will continue to focus
on the areas of improvement.
W.E.B. DuBois has a need to increase student attendance throughout the year.
W.E.B. DuBois overall ELPAC scores stayed the same our schools will concentrate efforts to increase our scores for the 2020-2021 school
year through professional development and increasing reading fluency and writing.
W.E.B. DuBois is progressing towards increasing graduation rates with CSI funds DuBois will work towards increasing graduation rates
above the state minimum required through coordinated planned efforts and evaluation of data.
Will increase the number of activities, such as sports, clubs
Students and Parents are requesting that we increase and expand our Career Pathways

Local Control and Accountability Plan Template Page 5 of 7
Dashboard Additional Report - DASS Graduation Rate
W.E.B. DuBois Public Charter (Fresno, CA)
Washington Unified
Reporting Year:
2021
This report displays graduation rates that were calculated using Dashboard rules. While this data is similar to the Four-Year Cohort data on
DataQuest, the data are not comparable. For the differences between this report and the reports on DataQuest,
Graduation Rate by Student Group
Student Group
Number of Students in the Graduation Rate
Number of Graduates
Graduation Rate

Local Control and Accountability Plan Template Page 6 of 7
All Students
26
25
96.2%
English Learners
5
*
*
Foster Youth
1
*
*
Socioeconomically Disadvantaged
25
24
96.0%
Students with Disabilities
5
*
*
African American
1
*
*
Asian
1
*
*
Hispanic
23
22
95.7%
Two or More Races
1
*
*
LCAP Highlights
A brief overview of the LCAP, including any key features that should be emphasized.
This year’s LCAP Plan highlights the progress our students and programs have made towards increasing student achievement in English
Language Arts and Math. The LCAP Plan also demonstrates our commitment to collaborate with all stakeholders in serving our students and
community at the highest level. The LCAP Plan highlights our action plan goals, which are aligned to the following eight priority state
indicators:
A. W.E.B. DuBois will increase student proficiency in English Language Arts, Math and Science.
a. Overall school performance in English Language Arts will increase by 2% in Year 1 and 3% in Year 2 and 5% in year 3 for a
total of 10% overall increase in Students scoring Proficient and Advance.
b. Overall school performance in Math will increase by 2% in Year 1 and 2% in Year 2 and 3 % in year 3 for a total of 7% overall
increase in Students scoring Proficient and Advance.
c. Overall school performance in Science will increase by 2% in Year 1 and 2% in Year 2 and 3 % in year 3 for a total of 7%
overall increase in Students scoring Proficient and Advance.
B. Long-Term English Language Learners will progress towards English Language Proficiency each year in speaking, listening, reading
and writing.
a. English learners enrolled in the school more than 90 days will improve their ELPAC Score by 1 proficiency level toward levels 3
and 4 each year.
b. 95% of students that are EL designated will complete the ELPAC exam.
c. Ensure 85% of long-term students complete pretesting and reading initiatives.
C. Our school will ensure our teachers are equipped with training, materials, support, and technology to implement the California Common
Core and increase academic achievement.
a. Teachers will receive 3 Professional Development specifically addressing learning losses and student engagement.
Local Control and Accountability Plan Template Page 7 of 7
b. All administrators will participate in two years of the Aspiring Administrators program to increase student performance and
staffing coaching and mentoring.
c. Teacher and administrators will receive 4 workshops addressing formative assessments, differentiated instruction strategies,
using manipulatives, software and visuals, and how to be culturally competent.
D. Our school goal will increase the number of planned activities to encourage parent participation in School Site Council, Parent Advisory
Council, ELAC, and Feedback Collection Initiatives
a. Our school will increase parent participation by 3% each year for each one of the advisory committees.
b. Parents will increase satisfaction by 1% each year or be above 91% with parent satisfaction outcomes.
E. Our school will maintain safe and clean facilities that promote learning with instructional support such as 1:1 Computer technology,
online libraries, on-site libraries, sports, summer enrichment, and after-school programs.
a. Our school will increase the number of clubs offered up to two new clubs per year.
b. Our school will increase student activities including sport offerings by 1-2 activities per year.
c. Our school will ensure restroom facilities and eating areas are cleaned after each break and lunch use including Before and
After-School.
d. Our School will increase classroom facility each year.
F. Our school will maintain a minimum of 90% attendance rate for DASS students.
a. Overall attendance for Special population (EL, Foster youth, Socio- Disadvantage and Students with disabilities) will increase
by 2% each year in Attendance.
b. Chronic Truancy will decrease by 2% each year and by 10% by year 5.
G. All students will have access to Career Pathways, Advanced Placement, and College Preparatory Course Options.
a. The School will expand Career pathways and CTE programs by 1 per year over the next 3 years based on students needs and
jobs in demand.
b. 60% of students will pass career pathway courses with a c or better by year 2 and 70% by year 3.
c. Student and parents surveys percentages will increase in career readiness satisfaction will by 10% by year 2 or by 91
percentage in year 3.
H. Students in our special needs populations will make satisfactory progress towards H.S. graduation requirements.
a. Overall High school graduation rate for 5-year cohort will increase above 75% in the first year and above 80% in second year
and above 83% in the third year.
b. Students in special populations including foster youth, students with disabilities, English Learners, and identified significant
groups such as Hispanic and African American will increase toward graduation by 2% each year.
Comprehensive Support and Improvement
An LEA with a school or schools eligible for comprehensive support and improvement must respond to the following prompts.

Local Control and Accountability Plan Template Page 8 of 7
Schools Identified
A list of the schools in the LEA that are eligible for comprehensive support and improvement.
W.E.B. DuBois Public Charter Schools is identified as a Comprehensive Support Improvement school in order to address and increase the
graduation rate. Our Single Plan for Student Achievement addresses the requirements for the CSI Plan. Our school has conducted a survey
each year of our stakeholders and in addition, we have reviewed our DASS Board and Data Quest data and modified our plan continually to
address areas of improvements. Finally from the needs assessment, the charter works with contracted consultants, technical assistance
provider FCSS and site leaders to create a professional development plan identifying areas of growth. The data is collected and compared
for growth measuring, professional development needs and modification of student individual learning plans. Stakeholders work with the
leadership team through the school’s School Site Council. The School Site Council receives a progress report semi-annually and is provided
with tools for analyzing data, formulating indicators and next steps. The LEA and site leadership team works with stakeholders identifying
interventions and barriers to overcome problems preventing graduating specifically among 5-year seniors. As a team, indicators such as (1)
Providing resources to assist our students with college, career readiness in order to increase number of students graduating on time or by
their original graduation date (2) Providing resources minimizing chronic absenteeism for students missing school due to loss of
engagement, learning loses, behavior, and/ or have left school to obtain employment due socioeconomic barriers (3) Analyzing and
evaluating data that contributed to decreased graduation rates due to a high number of student suspensions, low attendance, and course
failure in order to modify students Individual Learning Plans are determined as indicators for overcoming barriers. The LEA, stakeholder, site
leaders and with additional support from contracted consultants work in
Support for Identified Schools
A description of how the LEA has or will support its eligible schools in developing comprehensive support and improvement plans.
The Charters administration conducted a survey each year of our stakeholders including students and parents along with the review of our
DASS Board, Data Quest, and CALPADS data to continually modified our plan in order to address areas of improvements. The LEA works
with site leaders designing a plan for targeted tier interventions within student cohorts to better address academic learning losses and social-
emotional needs of students since the Pandemic. W.E.B. DuBois Public Charter is progressing towards increasing graduation rates with CSI
funds by working intensely with the CSI counselors creating individual learning plans and credit reduction evaluations. The individualized
learning plans, credit evaluations, along with career and college plans are utilized for every student to ensure they remain on track toward
graduation. The combination of personalized learning, family-like environment, tier interventions, career pathways and truancy prevention, all
contributes to fostering student initiatives exceling our graduation rates for seniors over 18 years old. In addition, students and parents are
provided with holistic services for entire family along with grant funded resources to develop career opportunities leading to partnerships with
non-profits, business, and post-secondary education providers. The LEA provides guidance and professional development to staff on
conducting meetings with various stakeholders including Fresno County Superintendent of Schools board adopted technical assistance
providers, Agape College of Business Science, Tools for Teachers, and Insight, as initial providers for professional development,
evaluations, and student workshops. The LEA provides the site leadership team with professional development evaluating and conducting
student workshops such as college fairs, financial aid, college registration seminars. With coordinated planned efforts and evaluation of
data, the LEA works with site leaders and community partners providing opportunities that lead to post-secondary education, civilian
leadership, and self-independence ensuring students become productive citizens. To support the school site, the needs assessment,
graduation rate, grade distribution and suspension rate data is analyzed to determine any factors that our disproportionality affecting the

Local Control and Accountability Plan Template Page 9 of 7
charters special populations. Through the analysis of data, the site and district leaders determine next steps at the campus level, and
develop additional resources for identified subgroups including special populations. The findings are incorporated into our ongoing progress
monitoring of inequities including the mobility rate and credit threshold.
W.E.B. DuBois Credit Eligible Graduation Rate
Year Credit Eligible Graduates Drops Credit Eligible Graduation Rate
2014-2015 31 30 1 96.8%
2015-2016 53 52 1 98.1%
2016-2017 31 30 1 96.8%
2017-2018 46 46 0 100.0%
2018-2019 19 19 0 100.00%
2019-2020 54 52 2 96.29%
2020-2021 26 25 1 98%
Monitoring and Evaluating Effectiveness
A description of how the LEA will monitor and evaluate the plan to support student and school improvement.
Our LCAP is measured by monitoring each students’ ability to demonstrate proficiency on measurable performance standards through
methods such as exit slips, unit tests, formative assessments, and tasks explicitly aligned to the Common Core State Standards. Learning is
also measured and monitored by the student’s ability to practically apply their knowledge in relevant ways. This is especially evident in our
PBL/CTE classes where student learning is demonstrated through the students’ ability to produce and present work products based on the
real-life problems and/or career connections and evaluated using standards-based rubrics. Progress monitoring indicators are reported bi-
monthly during leadership meetings by supporting staff and contracted providers. The evaluation of indicators and effectiveness will be

Local Control and Accountability Plan Template Page 10 of 7
guided by the measurable performance outcomes established within the SPSA which includes the CSI plan. District and site leaders use the
PLC to improve processes, review and evaluate levels of effectiveness based on data and looking at student growth in a school year. Site
leaders and consultants also conduct, monitor, evaluate next steps during PLCs. Based on data, site leaders work along with counselors
ensuring intervention and social emotional supports are aligned to the student data. Site leaders provide coaching to teachers to ensure
implantation of intervention and social emotional support are present and monitored within the classroom. Consultants continue to provide
professional development targets and support in the identified areas of need, as the site leaders compare current data to Dashboard
indicators.
The measurable performance outcomes include increasing the number of students graduating on time, decreasing our school’s suspension
rate, reducing truancy, and increasing student engagement in Math and English. Research based practices will consist of resources used as
references from the Center of Equity and Excellence in Education and Multi-Tier Intervention Models focused on student improvement. Data
will be used from SBAC, benchmarks, Individualized Learning Plans, surveys, DASS and other identified factors to measure improvement.

Local Control and Accountability Plan Template Page 11 of 7
Engaging Educational Partners
A summary of the process used to engage educational partners and how this engagement was considered before finalizing the LCAP.
W.E.B. DuBois leadership staff has made a concerted effort to ensure engagement of all stakeholders in the development of a
comprehensive Local Control Accountability Plan. Stakeholder meetings included: The non-profit governing board, School Site Council,
Principals, Teachers, Administrators, Parents, Pupils, and all staff.
W.E.B. DuBois is operated by Agape, a local 501c3 non-profit corporation. Oversight of Agape is operated and monitored by the
organizations CEO and policy development by the Governing Board for Fiscal and Liability matters. School Site Council provides oversights
of charter school Curriculum, Instruction, Single Plan for Student Achievement and campus safety matters.
Public Hearings were held on February 16, 2022, April 27, 2022, May 12, 2022 with final approval on May 31, 2022 with the ELAC/Parent
Councils and School Council. Public hearing May 23, 2022 with final approval June 01, 2022 with the Agape Board of Directors. Notifications
were provided to all stakeholders in accordance with the law. In separate meetings, the Agape Board of Directors and School Site Council
met to receive and discuss survey data collected from parents and students. The Boards also reviewed student academic performance data.
Parents and students attended multiple ELAC and Parent Council Meetings to provide input during the action items established on the
agenda. Parent comments from the public hearings were incorporated into this LCAP plan. The School Site Council met on, February 16,
2022, April 27, 2022, May 12, 2022, to discuss their responsibility in the ongoing monitoring of the LCAP. The Council reviewed survey data
from parents and contributed their own input to the continuation of program improvement
A summary of the feedback provided by specific educational partners.
W.E.B. DuBois leadership staff hosted Parent & Student LCAP information and data gathering meetings at School Site Council, Parent
Advisory Council and DELAC meetings on February 16, 2022, April 27, 2022, May 12,2022, May 31,2022 Staff presented updates on Agape
programs and initiatives and specifically discussed the progress of initiatives established by the LCAP.
Along with the newsletters, informational parent letters, school messenger notices and informational meetings, all DuBois students were
given the opportunity to complete the annual comprehensive survey to give feedback on multiple aspects of operations at DuBois. Survey
items included questions about EL Learners, College & Career Readiness, Instructional Strategies, Campus culture, Student Safety,
Instructional Materials, Teacher Support, Rigorous and Relevant instruction, Homeless and Foster Youth Policy, Parent Compact, and staff.

Local Control and Accountability Plan Template Page 12 of 7
Educational Partners
When
How
What input was provided
Parents Advisory /Senior
Meetings
Sept 29, 2021
Nov 17, 2021
Dec 7, 2021
Feb 8, 2022
Feb 16, 2022
Apr 27,2022
May 12,2022
May 31, 2022
Surveys of Parents, Public
Hearings, Informative Meetings
and Dialog
LCAP GOALS and CSI input
and information
School Site Council
Sept 29, 2021
Nov 17,2021
Dec 7,2021,
Feb 8,2022,
Feb 16, 2022
April 27,2022
May 12,2022
May 31, 2022
Surveys of Parents, Feedback,
Public Hearings and
Questionnaire, Informative
Meetings and dialog
LCAP GOALS, Curriculum,
Staff Recruitment and funding
DELAC/ English Language
Advisory Committee
Sept 29, 2021
Nov 17, 2021
Dec 7, 2021
Feb 8, 2022
Feb 16, 2022
April 27, 2022
May 12, 2022
May 31, 2022
Surveys of Parents, Feedback,
Public Hearings and
Questionnaire, Informative
Meetings and dialog
LCAP GOALS, El Programs,
Curriculum and funding
Fresno County Superintendent
of Schools
Fall, Winter, Spring 2021-2022
Feedback Meetings with
Consultants and Administration,
Professional Development, and
Technical Assistance Provider.
LCAP GOALS, Funding,
Actions, CSI
Career Pathway and Business,
Community Advisory
Committees
Business Advisory Meetings
Jul 15,2021
Jan 25,2022
Advisory input meetings, data
sharing of community and
employer needs.
LCAP GOALS, Career
Pathways, Funding,
Accreditation

Local Control and Accountability Plan Template Page 13 of 7
Mar 11,2022
Apr 16,2022
Allied Health Meeting
Mar 08, 2022
Students
Student Survey dates
Mar 29 to Apr 4,2022
Focus Group Meeting
May 23, 2022
Surveys, Interviews, and Focus
Groups
LCAP GOALS and Actions
Social Workers
Social Work meeting
Nov 5, 2021
Feb 15, 2022
Apr 25, 2022
Meeting to discuss Foster
Youth needs
Actions, CSI
Parents
Parent Meeting
Sep 29, 2021,
Nov 17,2021
Dec 7,2021,
Feb 8,2022,
Feb 16, 2022
April 27,2022
May 12,2022
May 31, 2022
Parent Survey Dates:
February 20 -April 4 , 2022
Surveys, Call Banks, Zoom
Meetings,
LCAP entire document
Teachers and Classified
support staff
PLC Meetings dates,
Aug/19/21,
Aug/30/21,
Surveys, Meetings, focus
groups, PLC’s
LCAP entire document

Local Control and Accountability Plan Template Page 14 of 7
Oct/22/21
Oct/28/21,
Nov/8/21,
Jan/12/22,
Jan/13/22,
Mar/9/22,
Mar/21/22
May/26/22,
Jun/6/22
June/10/22
Survey dates
May 13 to May 17, 2022
Focus Groups
June 10,2022
Agape Governing Board
Board Meeting dates
Feb 7, 2022
Apr 25,2022
May 23, 2022
Jun 01,2022
Governing Meetings, Public
Hearings
LCAP entire document, Focus
Group Initiative
School Leadership Meetings
Leadership Meeting and
Aspiring leadership meetings
Sept 20,2021
Jan 11,2022
Jab 24,2022
Feb 01,2022
Feb 8,2022
Focus Groups, Aspiring
Leaders Meeting, Needs
Assessment (Principals) PLC
LCAP entire document, Focus
Group Implementation

Local Control and Accountability Plan Template Page 15 of 7
Feb 15,2022
Feb 22,2022
Mar 18,2022
April 07, 2022
May 02,2022
May 24,2022
A description of the aspects of the LCAP that were influenced by specific input from educational partners.
The School Site Council ELAC and Parent meetings impacted the LCAP by giving key stakeholders the opportunity to become familiar with
the LCAP and develop the contents of the SPSA. Additionally, the SSC reviewed how data demonstrates areas needing improvement and
worked collaboratively to discuss solutions and interventions that need to be refined immediately and for the upcoming academic year.
Stakeholders provided input through surveys, public comments, electronic correspondence, and community meetings.
Goals and Actions
Goal
Goal #
Description
[Goal 1]
W.E.B. DuBois will increase student proficiency in English Language Arts, Math and Science.
An explanation of why the LEA has developed this goal.
W.E.B. DuBois Charter Schools has made gains towards mastering common core Math and English standards, however the goal and
identified need is to increase the number of students meeting and exceeding standards.
The following tables shows a three-year comparison of student achievement data, measured on the California Assessment of Student
Performance and Progress for Math and English Language Arts. Students meeting standards in Math have grown over the past three years,
however there is an identified need to increase the number of students who are meeting or exceeding standards. During the 2018-2019
school year, the percentage of students meeting standards in mathematics school year, the percentage of students meeting standards grew
to 10.19% and 4.32 for exceeding standards. For School year 2021 the percentage of students meeting standards went down to 5.24% and
the percentage of students exceeding standards were 2.09%.
The percentage of students meeting, and exceeding standards have grown over the past three years in ELA. During the 2017 - 2018 school
year, the percentage of students meeting standards in English Language Arts were17.39, and 5.43% for exceeding standards. By the 2018-
2019 school year, the percentage of students meeting standards grew to 20.99%, and the percentage of students exceeding standards grew
to 9.26%. By the 2020~2021 students meeting standards went down to 9.79%,and the percentage of students exceeding standard at 1.03%

Local Control and Accountability Plan Template Page 16 of 7
0%
10%
20%
30%
40%
50%
60%
70%
80%
90%
100%
advanced Proficient Basic Below Basic Far Below Basic
Math Spring Benchmark
k 1 2 3 4 5 6 7 8 Geo Alg Integ
This trend towards academic growth is also reflective with the decrease in the percentage of students not meeting standards. In 2016-2017,
the number of students not meeting standards were 54.74%, whereas during the 2018-2019 school year, the students not meeting standards
decreased to 41.36%. With the decrease in the population of students not meeting standards, and the increase of students meeting and
exceeding standards, students at W.E.B. DuBois have made significant gains towards mastering Common Core State Standards in English
language arts. Information provided by the California Dashboard indicated significant increases in English language academic performance
of 13.38 points.
0%
10%
20%
30%
40%
50%
60%
70%
80%
90%
100%
Advanced Proficient basic Below Basic Far Below Basic
ELA Spring Benchmark
K 1 2 3 4 5 6 7 8 9 10 11 12

Local Control and Accountability Plan Template Page 17 of 7
CAASPP Math Data: 2016-2017 to 2020-2021
School
Year
Not Meeting Standards Nearly Meeting Standards
Meeting
Standards
Exceeded
Standards
2016-2017
72.73%
17.11%
8.56%
1.6%
2017-2018
71.58
15.43%
7.86%
5.46%
2018-2019
64.81%
20.37%
10.19%
4.32%
2019-2020
19-20 SBAC Suspended by the state due COVID 19
3.79%
Cumulative
69.70% (Average
17.63% (Average Increase of
8.87% (Average
(Average
Average
Decrease of 7.92%)
3.26%)
Growth of 1.63%)
Growth of
2.72%)
CAASPP ELA Data: 2016-2017 to 2019-2020
School Year
Not Meeting Standards
Nearly Meeting Standards
Meeting Standards
Exceeded Standards
2016-2017
54.74%
29.47%
14.21%
1.58%
2017-2018
52.72%
24.47%
17.39%
5.43%
2018-2019
41.36%
28.40%
20.99%
9.26%
2019-2020
19-20 Not Applicable Standardized Testing Suspended by the state due to the pandemic
Cumulative Average
49.60% (Average Decrease of
13.38%)
27.44% (Average decrease of
1.07%)
17.53% (Average Growth of
6.78%)
5.42% (Average
Growth of 7.68%)

Local Control and Accountability Plan Template Page 18 of 7

Local Control and Accountability Plan Template Page 19 of 7

Local Control and Accountability Plan Template Page 20 of 7

Local Control and Accountability Plan Template Page 21 of 7

Local Control and Accountability Plan Template Page 22 of 7
Measuring and Reporting Results
Metric Baseline Year 1 Outcome Year 2 Outcome Year 3 Outcome
Desired Outcome for
2023–24
Math SBAC
Data Year 2020-2021
SBAC 2020-21
MATH Scores
exceeding or meeting
standards was 7.33%
EL: 3.77%
FY: N/A
LI: 6.99%
HL.0%
SWD: 12.5%
Data Year 2020-2021
SBAC 2020-21
MATH Scores
exceeding or meeting
standards was 7.33%
EL: 3.77%
FY: N/A
LI: 6.99%
HL0%
SWD: 12.5%
SBAC 21-22
SBAC 22-23
Math will increase by
9% overall in
Students scoring
Proficient and
Advance.
EL: 5.77%
LI 9%
HL 5% if possible
SWD 14%
Science SBAC
Data Year 2020-2021
SBAC 2020-21
Science Scores
exceeding or meeting
standards was 1.32%
EL 1.72%
LI 1.33%
HL 0%
SWD 0%
Data Year 2020-2021
SBAC 2020-21
Science Scores
exceeding or meeting
standards was 1.32%
EL 1.72%
LI 1.33%
HL 0%
SWD 0%
3% overall increase
in Students scoring
Proficient and
Advance.
EL 2% If possible
LI 3%
HL 2%
SWD 3%

Local Control and Accountability Plan Template Page 23 of 7
Metric Baseline Year 1 Outcome Year 2 Outcome Year 3 Outcome
Desired Outcome for
2023–24
ELA SBAC
Data Year 2020-2021
SBAC 2020-21
English Language
Arts exceeding or
meeting standards
was 10.82%
EL 13.48%
LI 10.58%
HL 0%
SWD 0%
Data Year 2020-2021
SBAC 2020-21
English Language
Arts exceeding or
meeting standards
was 10.82%
EL 13.48%
LI 10.58%
HL 0%
SWD 0%
13% overall increase
in Students scoring
Proficient and
Advance
EL 15.48%
LI 12.58%
HL 2%
SWD 2%

Local Control and Accountability Plan Template Page 24 of 7
Actions
Action # Title Description
Total
Funds
Contributing
[Action
1]
Overall school
performance in
English Language
Arts will increase
by meeting
standards or
exceeding
standards
Overall school performance in English Language Arts will increase by 2% in Year 1 and 3% in
Year 2 and 4% in year 3 for a total of 9% overall increase in Students scoring Proficient and
Advance.
1. All Students will utilize at least 1 online tutorial subscription
a. Achieve 3000, Edgenunity, interactive programs are used to provide individualized
intervention.
1. Intervention and Remediation courses taught either before, after and during Saturday
school.
a. Two sections of Intervention Foundational English class were provided for students who
need additional practice with basic skills.
i. Multiple Tier Support Systems: Best practices and Student Tier and Equity
interventions are utilized.
ii. Designated ELD (EL Population)
b. Consistently administer formative/summative
assessments utilizing data to ascertain explicit,
instructional planning necessary to increase in student achievement among:
i. EL, Homeless, Foster, Low-income students
ii. SPED and 504 modification and accommodation
2. Common-Core Standards and Supplement
a. ELA supplemental materials:
i. Common Core Reading and Writing workbooks
ii. Professional development for literacy, EL Standards and SEL
b. Science supplement materials:
i. NGSS
ii. Professional development for claims, evidence and reasoning support
c.
The curriculum and instruction focus group has adopted CCSS aligned materials and will
continue to research additional supplemental materials to support implementation.
$2,290,863
LCFF:
$1,396,252
Lottery:
$74,241
After
School
Program:
$61,910
ELO
Program:
$202,614
Title I
$172,428
ESSER III
$383,418
Y

Local Control and Accountability Plan Template Page 25 of 7
Action # Title Description
Total
Funds
Contributing
[Action
2]
Overall
mathematics
school
performance will
increase each year
to meeting or
exceeding
standards each
year
Overall school performance in Math will increase by 2% in Year 1 and 2% in Year 2 and
3 % in year 3 for a total of 7% overall increase in Students scoring Proficient and
Advance.
1. All Students will be provided at least 1 Online tutorial subscription
a. Go Math, Edgenunity, interactive programs are used to provide individualized
intervention.
2. Intervention and remediation courses will be taught before, after and during
Saturday school to address learning losses.
a. MTSS: Best practices, Student Tier and Equity
b. Consistently administer formative/summative assessments utilizing data to
ascertain explicit, instructional planning necessary to increase in student achievement.
i. EL, Homeless, Foster, Low-income students
ii. SPED and 504 modification and accommodation
3. Add additional Math tutors to Math courses to assist in student tutoring.
A. Math supplement materials:
i. A New Math Adoption for 9th through 12th for the 222-23 and Go Math will
continue to be utilized for middle school
ii. Professional development for computations, EL Standards and EL
$638,618
LCFF:
$516,641
Educator
Effect:
$93,627
Donations:
$8,279
ESSER III:
$20,071
Y

Local Control and Accountability Plan Template Page 26 of 7
Action # Title Description
Total
Funds
Contributing
Action 3
Overall school
performance in
science will
increase by
meeting standards
or exceeding
standard each
year
Overall school performance in Science will increase by 2% in Year 1 and 2% in Year 2
and 3 % in year 3 for a total of 7% overall increase in Students scoring Proficient and
Advance.
1.. Science supplement materials including project based learning will be utilized.
i. NGSS
ii. Professional development for claims, evidence and reasoning support
iii. The board of directors have adopted Discovery aligned materials and will
continue to research additional supplemental materials to support implementation.
2. Offered competitive salary maintain high quality teachers.
a. Offer competitive salaries in order to attract and
b . Consistently administer formative/summative assessments utilizing data to
ascertain explicit, instructional planning necessary to increase in student achievement.
i. EL, Homeless, Foster, Low-income students
ii. SPED and 504 modification and accommodation
3. Common-Core Standards and Supplement
a. ELA supplemental materials:
Common Core Reading and Writing workbooks
Science supplement materials:
NGSS
Professional development for claims, evidence and reasoning support
$99,892
LCFF:
$99,892
Goal Analysis for [LCAP Year]
An analysis of how this goal was carried out in the previous year.
A description of any substantive differences in planned actions and actual implementation of these actions.
This trend towards academic growth is also reflective with the decrease in the percentage of students not meeting standards. In 2018-2019,
the number of students not meeting standards were 41.36% whereas during the 2019-2020 school year, the students not meeting standards
increased to 66.49%. With the decrease in the population of students not meeting standards, and the increase of students meeting and
exceeding standards, students at W.E.B. DuBois have made significant gains towards mastering Common Core State Standards in English
language arts. Information provided by the California Dashboard indicated significant increases in English language academic performance.

Local Control and Accountability Plan Template Page 27 of 7
An explanation of material differences between Budgeted Expenditures and Estimated Actual Expenditures and/or Planned Percentages of
Improved Services and Estimated Actual Percentages of Improved Services.
For Goal #1, we have reduced expenditures towards this goal of intervention by $727,050; due to the pandemic and other factors, additional
funds have been spent on this goal due to the challenges of the pandemic and students who have fallen behind in the transition back to in-
person learning. We have spent considerable funds on learning devices such as chrome books, iPads, laptops, counselors, and additional
instructional aids.
An explanation of how effective the specific actions were in making progress toward the goal.
We are currently reviewing a new Math adoption and other supplemental programing to further increase our examination CAASPP scores.
We will continue to offer extended learning opportunities.
We currently are providing extended learning opportunities though Before and After School programs including designated Saturday
Schools. Students are also provided instruction through multiple platforms such as hybrid, in-person and interactive platforms to reduce loss
of learning.
A description of any changes made to the planned goal, metrics, desired outcomes, or actions for the coming year that resulted from reflections
on prior practice.
We have currently review our goals based on evidence from DASH Board, Bench marks and Data Quest changes have been made
conservatively to reflect our data and also stakeholder input. Incentives have been added to increase student engagement. Additionally,
project based learning will be incorporated as reflected in our charter
A report of the Total Estimated Actual Expenditures for last year’s actions may be found in the Annual Update Table. A report of the
Estimated Actual Percentages of Improved Services for last year’s actions may be found in the Contributing Actions Annual Update
Table.

Local Control and Accountability Plan Template Page 28 of 7
Goals and Actions
Goal
Goal #
Description
[Goal 2]
Long-Term English Language Learners will progress towards English Language Proficiency each year in speaking, listening,
reading and writing.
An explanation of why the LEA has developed this goal.
The number of W.E.B. DuBois students tested during the 2020-2021 Summative ELPAC assessment was 97 students. Overall, 14.43% of
students performed at a level 4, the Well-developed Performance Level. 22.68% of students performed a level 3, the Moderately-developed
Performance level. 36.36% of students performed at a level 2, the Somewhat-developed Performance level. Finally, 0% of students scored
at the Beginning Performance Level of 1.
DuBois made progress towards mastery of English Language proficiency as only 12% of students scored at the Beginning Performance
Level. Ensuring Long-term English Learners progress towards English Language Proficiency each year remains an identified need because
we want 100% of Long-Term English Language. ELD Standards and ELD/ SDAIE strategies were provided to TK-12 grade teachers are
what they should be implementing when working with EL students. Our staff meeting focused on specific strategies that should be used, as
well as a monitoring tool to ensure that teachers are using the ELD strategies weekly. FCSS provides Agape Schools, Inc. administration
with support regarding ELD standards and the new leveling system with ELPAC-English Learner Proficiency Assessment. Programs such as
e RAZ Kids for Grades TK-3 and Achieve3000 for grades 4-12; allow EL students to listen to fluent readers to build their level of English and
reading fluency. Professional development to improve pedagogy and support for teachers regarding instruction focused on language
development and oral fluency in all classes from Tk through 12th Grade.
Learners to progress toward English Language Proficiency.

Local Control and Accountability Plan Template Page 29 of 7
2019–20 results are not available due to the suspension of testing as a result of the novel coronavirus disease 2019 (COVID-19).

Local Control and Accountability Plan Template Page 30 of 7
W.E.B. DuBois Public Charter School EL Redesignation
Measuring and Reporting Results
Metric Baseline Year 1 Outcome Year 2 Outcome Year 3 Outcome
Desired Outcome for
2023–24
Long-term Students
completing ELPAC will
make progress in
Reading, Listening,
writing, and speaking. In
addition, They will
increase participation rate.
Data year :2020~
2021
Data Source: ELCAP
DuBois had 14.43%
students score a
Level 4, and 22.68%
scored a Level 3.
Data year :2020~
2021
Data Source: ELCAP
DuBois had 14.43%
students score a
Level 4, and 22.68%
scored a Level 3.
ELPAC 21-22
ELPAC 22-23
10% of overall EL
students that qualify
as Long-term EL will
increase 1
performance Band
toward Level 3 or 4
from 1 or 2.
English Learner
participation rate 95%
Data Year 2020-
2021
Data Source: ELCAP
EL- Participation rate
99%
Data Year 2020-
2021
EL-Participation 99%
97% of students that
are EL designated
will complete the
ELPAC exam
School Year
Enrollment
English Learners
Fluent-English-
Proficient Students
Students
Redesignated
FEP
W.E.B. DuBo
2022
348 101 (29%) 40 (11.5%) 0
2021 337 95
( 28.2 %) 54 ( 16.0 %) 0 ( 0.0 %)
2020 338 94 ( 27.8 %) 65 ( 19.2 %) 8 ( 7.0 %)
2019 352 114
( 32.4 %) 64 ( 18.2 %) 15 ( 11.8 %)
2018 373 127
( 34.0 %) 54 ( 14.5 %) 8 ( 7.1 %)

Local Control and Accountability Plan Template Page 31 of 7
Performance Level
Listening
Speaking
Reading
Writing
%
#
%
#
%
#
%
#
Well
Developed
17
17
39
38
8.25
8
5.21
5
Somewhat/Moderately
63
61
44
43
37
36
59
57
Beginning
18.75
18
16.49
16
54
53
35
34
Metric Baseline Year 1 Outcome Year 2 Outcome Year 3 Outcome
Desired Outcome for
2023–24
Reclassification Rate
Data Year 2020-
2021
Data Source:
ELCAP, CALPADS
English Learners
29.02%
Fluent-English-
Proficient Students
11.5%
Students
Redesignated FEP
0%
EL : 0
Redesignations
Data Year 2020-
2021
Data Source:
ELCAP, CALPADS
English Learners
29.02%
Fluent-English-
Proficient Students
11.5%
Students
Redesignated FEP
0%
EL : 0
Redesignations
7 Students will be
reclassified.
Data year :2020~ 2021
Data Source: ELCAP
Overall
Oral
Written
Performance
Level
%
#
%
#
%
#
Level
4
14
14
14
24
7.22
7
Level
3
22
22
35
34
18.56
18
Level
2
37
36
31
30
27.84
27
Level
1
25
25
9.28
9
46.39
45

Local Control and Accountability Plan Template Page 32 of 7
Actions
Action #
Title
Description
Total Funds
Contributing
[Action 1]
English Language Learners
Instructional Strategies
English learners enrolled in the school more than 90 days will improve their ELPAC
Score by 1 proficiency level toward levels 3 and 4 each year.
ELD professional development
a. Fresno County Superintendent of Schools will provide virtual PD on the ELA/ELD
Framework as well as ELD standards.
b. PLCs on best practices for EL instruction including but not limited to
Academic/Content Vocabulary, questioning strategies, communication strategies,
multiple modalities, etc.
2. Adopted and purchased print and electronic online learning materials to support
English Language Learners.
a. Online and print instructional materials were adopted that meet student’s
individual instructional needs. These materials specially focus on developing
listening, speaking, writing, and English comprehension skills.
3. ELD/Intervention Foundational English classes are built into the master schedule to
support English language development.
a. English Learning Authorization certification for teachers
4. Teachers utilized the following supplement strategies to meet expected outcomes
for supporting English Language Learners:
• Visuals and graphic organizers to help scaffold content
Listening and speaking strategies
• Use of Achieve3000 to support current reading levels and assist in improving
reading levels.
• Spanish language text is available through Achieve 3000.
• 1-to-1 computer devices
• Collaborative groups, learning stations, and cooperative assignments
5. Data Drive Instruction (DDI) and modification will be discuss in PLC’s
$568,391
LCFF:
$550,008
Lottery:
$18,383
Y
[Action 2]
EL designated will complete the
ELPAC exam
Ensure 95% of long-term students complete pretesting and reading
initiatives.
Ensure 95% of EL students meet test participation rate.
a. Attendance tracking and home visits
b. Parents training and outreach
Materials in various languages based on the home language survey.
$48,987
LCFF:
$48,987
Y

Local Control and Accountability Plan Template Page 33 of 7
Action #
Title
Description
Total Funds
Contributing
[Action #3]
Long-term students will be
reclassified that score at level 4
and meet all qualifying factors
for reclassification
Students will meet all the factors associated with reclassification
including scoring level 4 on the ELPAC. SBAC must be at Basic or
above in ELA. Or
Students will meet the local assessment factor within the EL Plan.
Students will be provided tutoring to increase ELPAC and SBAC scores
to meet the additional criteria.
$45,889
LCFF:
$45,889
Y
Goal Analysis for [LCAP Year]
An analysis of how this goal was carried out in the previous year.
A description of any substantive differences in planned actions and actual implementation of these actions.
DuBois successfully increased the number of EL redesignations for 2018-2019 and 2019-2020 prior to the pandemic-based school closures
in Spring 2020. Due to the suspension of the ELPAC that year, no students were reclassified to start the 2021-2022 school year. School
officials anticipate additional students being Redesignated as Fluent English Proficient (RFEP) in 2022-2023 based on Spring 2022 test data
and additional state requirements.
An explanation of material differences between Budgeted Expenditures and Estimated Actual Expenditures and/or Planned Percentages of
Improved Services and Estimated Actual Percentages of Improved Services.
Goal #2 estimated actuals dollars are decreased by $771; however, this difference is immaterial and $512,999 funds are being spent on this
goal to bridge the gaps and creating greater equity for these students to succeed which is an important value of the W.E.B. DuBois Public
Charter School.
An explanation of how effective the specific actions were in making progress toward the goal.
The actions were increased for the new school year to mark progress for the 2021-22 and 2022-23 school year.
A description of any changes made to the planned goal, metrics, desired outcomes, or actions for the coming year that resulted from reflections
on prior practice.
The changes in the goal and action plan represent the necessity according to our ELPAC prior scores to increase the number of student
scoring at above proficiency Level as DuBois has done prior to the Pandemic and learning loses.
Local Control and Accountability Plan Template Page 34 of 7
A report of the Total Estimated Actual Expenditures for last year’s actions may be found in the Annual Update Table. A report of the
Estimated Actual Percentages of Improved Services for last year’s actions may be found in the Contributing Actions Annual Update
Table.

Local Control and Accountability Plan Template Page 35 of 7
Goals and Actions
Goal
Goal #
Description
[Goal 3]
Our school will ensure our teachers are equipped with training, materials, support, and technology to implement the
California Common Core Standards and increase academic achievement.
An explanation of why the LEA has developed this goal.
Teachers are well equipped with technology, training, and support to implement common core. The identified need is in the area of teachers
having access to a District wide pacing guide for all core content areas.
Measuring and Reporting Results
Metric Baseline Year 1 Outcome Year 2 Outcome Year 3 Outcome
Desired Outcome for
2023–24
Professional
Development
96% Teachers
reported on a survey
they were trained on
instructional
strategies for our
students that promote
creativity, critical
thinking, collaboration
and communication.
SY 2021-2022
Data Source:
Teacher Surveys
96%Teachers
reported on a survey
they were trained on
instructional
strategies for our
students that promote
creativity, critical
thinking, collaboration
and communication.
SY 2021-2022
Data Source:
Teacher Surveys
97% Teachers will
report that they are
trained on
instructional
strategies for our
students that promote
engagement,
creativity, Critical
Thinking,
Collaboration, and
Communication

Local Control and Accountability Plan Template Page 36 of 7
Metric Baseline Year 1 Outcome Year 2 Outcome Year 3 Outcome
Desired Outcome for
2023–24
Aspiring
Administration
Professional
Development
Data Year 2021-2022
Data Source: AAPD
evaluations
87% of administration
score proficient on
the Aspiring
Administrators
elevation.
Data year 2021-2022
Data Source: AAPD
evaluations
87% of administration
score proficient on
the Aspiring
Administrators
elevation.
92% of administration
will scored proficient
on the Aspiring
Administrators
elevation.

Local Control and Accountability Plan Template Page 37 of 7
Actions
Action #
Title
Description
Total Funds
Contributing
[Action 1]
Teacher Professional
Development
Teachers will receive 3 additional Professional Developments specifically
addressing learning losses and student engagement.
Provided comprehensive professional development agreement with Fresno
County Office of Education.
a. SDE and FCSS provided the following services for the 2020-2021
school year:
i. Professional Development Days
ii. In-Class Coaching Days
2. Professional Development focused on Academic Rigor, Common Core
Supplements and Social Emotional Learning (SEL)
a. This includes:
i. SDE Provided- Non-Negotiables, Look For’s, Standards align,
Mapping, Pacing, Differentiated Instruction, DOK 3-4 to enhance
instruction to increase rigor and depth of knowledge levels and
Academic Vocabulary.
ii. Achieve3000 program, PD
iii. Go Math program and PD
iv. Intensive focus on CCSS and instructional strategies in bi-weekly
PLC’s.
v. Blended (Hybrid and Distance) Learning
vi. Social Emotional Learning PD
vii. GATE training and coaching
3. Maintained qualified support personnel including instructional technology
support staff.
4. Purchase and acquired additional technology software (staff and student
devices)
a. Desktop computers upgrades to facilitate use of instructional
technology. (Mac/Dell/HP)
b. Mac, Chromebooks, Tablets software updates and Hotspots
c. Online licenses for textbooks, supplement materials and digital
software
$134,433
LCFF:
$128,255
Title II
$6,178
Y

Local Control and Accountability Plan Template Page 38 of 7
Action #
Title
Description
Total Funds
Contributing
[Action #2]
Aspiring Administrators
program
All administrators will participate in two years of the Aspiring
Administrators program to increase student performance and staffing
coaching and mentoring. Trainings will reflect professional development
in the areas of instructional strategies for teacher, mentoring and
coaching.
$14,800
LCFF:
$14,800
Y
[Action #3]
Teacher and Administrator
workshop
Teacher and administrators will receive 4 workshops addressing
formative assessments, differentiated instruction strategies, using
manipulatives, software and visuals, and how to be culturally competent.
$80,500
LCFF:
$80,500
Y
Goal Analysis for [LCAP Year]
An analysis of how this goal was carried out in the previous year.
A description of any substantive differences in planned actions and actual implementation of these actions.
Currently we have increased the number of professional development days per each teacher. In addition, we have begun to implement our
Aspiring administrators’ program. There are no substantive changes for Goal #3 other than increasing the resources to implement our action
items.
An explanation of material differences between Budgeted Expenditures and Estimated Actual Expenditures and/or Planned Percentages of
Improved Services and Estimated Actual Percentages of Improved Services.
Goal #3 dollars were decreased by $10,380 to realign dollars to other goals focused on intervention of students not meeting education
standards due to assessment data as well as keeping the conditions of learning optimal for students by focusing on safe, clean facilities.
W.E.B. DuBois is still focused on the professional development of our teachers and spent estimated actuals of $207,306 on this goal in 2021-
22.
An explanation of how effective the specific actions were in making progress toward the goal.
Our data reflects that the new updated goals and actions are increasing student participation and engagement.

Local Control and Accountability Plan Template Page 39 of 7
A description of any changes made to the planned goal, metrics, desired outcomes, or actions for the coming year that resulted from reflections
on prior practice.
[The aspiring administrative program has increased in the number of teachers applying. ]
A report of the Total Estimated Actual Expenditures for last year’s actions may be found in the Annual Update Table. A report of the
Estimated Actual Percentages of Improved Services for last year’s actions may be found in the Contributing Actions Annual Update
Table.

Local Control and Accountability Plan Template Page 40 of 7
Goals and Actions
Goal
Goal #
Description
[Goal 4]
Our school goal will increase the number of planned activities to encourage parent participation in School Site Council,
Parent Advisory Council, ELAC, and Feedback Collection Initiatives.
An explanation of why the LEA has developed this goal.
The parent participation in shared governance councils such as the Parent Advisory Council and English Language Advisory Council for the
2020-2021 school year had a less than 31% attendance rate. Additionally, for the 2020-2021 school year, the response rate for the LCAP
survey was less than 22%. The school aims to increase the survey response rate and parent participation in shared governance meetings
annually. This year, both school sites formed a School Site Council, so it is imperative that increased parent participation in shared
governance councils remain an identified need.
Measuring and Reporting Results
Metric Baseline Year 1 Outcome Year 2 Outcome Year 3 Outcome
Desired Outcome for
2023–24
Parent Survey Rating
Data Year 2021-
2022
Data Source: LCAP
Survey
Parent Satisfaction
94%
Data Year 2021-
2022
Data Source: LCAP
Survey
Parent Satisfaction
94%
Parent Satisfaction
will be above 96.5%
with parent
satisfaction
outcomes.
Participation/attendance
in key committees (
SSC , DELAC)
Data Year 2021-
2022
Data Source: LCAP
Survey
Parent Participation
22%
Data Year 2021-
2022
Data Source: LCAP
Survey
Parent Participation
22%
Increase parent
participation by 1.5%
each year for each
one of the advisory
committees.

Local Control and Accountability Plan Template Page 41 of 7
Actions
Action #
Title
Description
Total Funds
Contributing
[Action 1] Increase Parent Involvement
Our school will increase parent participation by 3% each year for each
one of the advisory committees.
1.Family Communication for outreach, PBIS and MTSS
a. Supported staff hours to make phone calls.
b. Home-visit
c. Social Emotional Learning (SEL)
MTSS (Multi-Tiered System of Support)
d. Newsletters, email and text messaging
2. School Messenger Subscription to increase parent/guardian
communication
a. School Messenger
b. Auto dialer, email and text messenger
3. Student/Parent Recognition for all students
a. Student Incentive (School Attendance)
b. Parent forums (Virtual and in person)
c. School Survey
d. Monitor student progress though teacher and Aries softer.
e. Student award ceremonies
4. Use of social media platforms such as the school’s Facebook.
$19,309
LCFF:
$19,309
Y

Local Control and Accountability Plan Template Page 42 of 7
Action #
Title
Description
Total Funds
Contributing
[Action 2]
Increase Parent Survey
Satisfaction
Parents will increase satisfaction by 1% each year or be above 91% with
parent satisfaction outcomes.
School Messenger Subscription to increase parent/guardian
communication
a. School Messenger
b. Auto dialer and email, social media, and texting messenger
Student/Parent Recognition for all students
a. Student Incentive (School Attendance)
b. Parent forums (Virtual and in person)
d. Monitor student progress though teachers and Aeries software
e. Student award ceremonies
Use of social media platforms such as the school’s Facebook
$5,250
LCFF:
$5,250
Y
Goal Analysis for [LCAP Year]
An analysis of how this goal was carried out in the previous year.
A description of any substantive differences in planned actions and actual implementation of these actions.
[We have added text messaging as requested by parents the use of more social media to improve parent participation]
An explanation of material differences between Budgeted Expenditures and Estimated Actual Expenditures and/or Planned Percentages of
Improved Services and Estimated Actual Percentages of Improved Services.
Goal #4 dollars are decreased by $431 due to savings from Zoom sessions and use of other technology platforms which changed from when
costs were originally projected.
An explanation of how effective the specific actions were in making progress toward the goal.
Parent participation has increased by 10% compared to the prior year. Parents have been actively logging in online to School Site Council
and ELAC meetings, additionally parents have begun to attend onsite events. We are also continuing to survey parents to gather stakeholder
input. We have increased parental involvement by establishing 1:1 device for our students which provides parents with the convenience and
accessibility to attend parent meetings online and receive notifications of upcoming events. Parent input is readily accepted and infused into
our board-level decisions in the form of surveys, personal calls, text and emails. Parents have requested in our most recent survey that we

Local Control and Accountability Plan Template Page 43 of 7
utilize text messaging as the number one contact option. Also, in the schools most recent survey 98% of parents stated that they are well
informed of school activities and events including meetings.
A description of any changes made to the planned goal, metrics, desired outcomes, or actions for the coming year that resulted from reflections
on prior practice.
no substantial change.
A report of the Total Estimated Actual Expenditures for last year’s actions may be found in the Annual Update Table. A report of the
Estimated Actual Percentages of Improved Services for last year’s actions may be found in the Contributing Actions Annual Update
Table.

Local Control and Accountability Plan Template Page 44 of 7
Goals and Actions
Goal
Goal #
Description
[Goal 5]
Our school will maintain safe and clean facilities that promote learning with instructional support such as 1:1 Computer
technology, online libraries, on-site libraries, sports, summer enrichment, and after-school programs.
An explanation of why the LEA has developed this goal.
Our parents were surveyed and participated in focus groups expressing improvement with goal 5 by increasing activities, trips and
Incentives.
Measuring and Reporting Results
Metric Baseline Year 1 Outcome Year 2 Outcome Year 3 Outcome
Desired Outcome for
2023–24
Clubs / Sports
Activities
Data year: 2020-2021
Clubs offered 1
Data Source: After
School program
report.
Data year: 2021-2022
Clubs offered
Data Source: After
School program
report.
The school will offer
up to 2 additional
student clubs each
year for all students.
After school Program
Data year:
2020~2021
Data Source: After
School program
report.
Offered No sports
only practice
tournaments.
Data year:
2021~2022
Data Source: After
School program
report.
2 New sports were
offered.
The school will offer a
total of 3-5 sports per
year and add 1 new
sport each year.

Local Control and Accountability Plan Template Page 45 of 7
Actions
Action #
Title
Description
Total Funds
Contributing
[Action 1]
Increase the number of clubs
and sports for students
Our school will increase the number of clubs offered up to two new clubs
per year. Our school will increase the number of sports programs.
Health and Wellness for all students including sports and club activities will be
facilitated though the following:
a. Summer Programs
b. Afterschool Intervention program
c. Physical Education Enrichment, and new sports
d. SEL: Social Emotional Learning support
e. Mental health consultants for staff and students
f. Purchase, lease, or build new facilities for sports,
fitness, and recreational facilities and equipment to enhance health and
wellness.
Sports, fitness, and recreational facilities and
equipment are purchased and replaced as
necessary to support health and
fitness to support health and fitness for
physical education and activity.
g. PBIS and Alternative to suspension
$84,375
LCFF:
$17,676
Unrestr
Lottery
$66,699
Y

Local Control and Accountability Plan Template Page 46 of 7
Action #
Title
Description
Total Funds
Contributing
[Action 2] Increase student activities
Our school will increase student activities including tutoring, Saturday
school, and sports offerings by 1-2 activities per year.
Health and Wellness for all students
a. Summer Programs
b. Afterschool and Saturday Intervention program
c. Physical Education and Enrichment
d. SEL: Social Emotional Learning support
e. Mental health therapist and consultants for staff and students
f. Purchase or lease and maintain sports,
fitness, and recreational facilities and equipment to enhance health and
wellness.
Sports, fitness, and recreational facilities and
equipment are purchased and replaced as
necessary to support health and
fitness to support health and fitness for
physical education and activity.
g. PBIS
h. Increase the number of clubs by 1 per year.
i. Increase the number of field trips by 2 per year.
j. Increase students incentives for students attending activities.
$70,500
LCFF:
$70,500
Y

Local Control and Accountability Plan Template Page 47 of 7
Action #
Title
Description
Total Funds
Contributing
[Action 3]
Increase Facilities ensuring
Safe and clean Restroom and
Eating areas is a school
priority.
Our school will increase facilities over the next 3 years including adding
classrooms and new gym building to alleviate crowding.
Our school will be safe and will ensure restroom facilities and eating areas are
cleaned after each break and lunch use including Before and After-School.
Maintain safe and high-quality facilities materials, supplies and repairs.
a. Mobile handwashing stations
b. Disinfecting mist machines (foggers)
c. Cleaning and sanitizing upgrades
d. PPE
2. COVID -19 Procedures and Protocols for prevention and safety for students,
staff and visitors
a. Janitorial Compliance Requisition Forms
b. PPE
c. HVAC
2. Camera’s for security will be purchased for each school site as requested
by parents.
$435,470
LCFF:
$385,970
ESSER III:
$49,500
Y
Goal Analysis for [LCAP Year]
An analysis of how this goal was carried out in the previous year.
A description of any substantive differences in planned actions and actual implementation of these actions.
W.E.B DuBois has invested in meeting this goal by purchasing enough technology to have a 1 to 1 ratio for all students. Additionally,
students have access to online libraries through LIRN. We continue to work on the utilization of the online library to strengthen student
research and writing. As a part of our extended learning plan we have expanded afterschool, Saturday school, and summer school activities
by extending the length of time or increasing the number of days students are able to utilize these programs. W.E.B. DuBois Public Charter
School Students participate in our schools sports programs and have expressed through surveys they want to add more sports offerings with
that said DuBois added soccer and mush ball this year. Our current facilities are not sufficient for current population.
An explanation of material differences between Budgeted Expenditures and Estimated Actual Expenditures and/or Planned Percentages of
Improved Services and Estimated Actual Percentages of Improved Services.

Local Control and Accountability Plan Template Page 48 of 7
Goal #5 dollars are increased by $233,552 due to ensuring that facilities are clean, sanitized, and that the facilities are in good condition. For
instance, HVAC units were purchased with filtering to increase air quality. Additionally, our school purchased more technology to replace
broken technology and to get to a 1 to 1 ratio.
An explanation of how effective the specific actions were in making progress toward the goal.
W.E.B. DuBois Public Charter School has invested in meeting this goal by purchasing enough technology to have a 1 to 1 ratio for all
students. Additionally, students have access to online libraries through LIRN. We continue to work on the utilization of the online library to
strengthen student research and writing. As a part of our extended learning plan we have expanded afterschool, Saturday school, and
summer school activities by extending the length of time or increasing the number of days students are able to utilize these programs. We
are still purchase W.E.B. DuBois Public Charter School Students participate in our schools’ sports programs and have expressed through
surveys they want to add more sports offerings with that said DuBois added soccer and mush ball this year.
A description of any changes made to the planned goal, metrics, desired outcomes, or actions for the coming year that resulted from reflections
on prior practice.
Significant changes have been made in accordance to what parents and students requested on surveys, and focus groups. This includes
more secure campuses, sports, activities and clubs
A report of the Total Estimated Actual Expenditures for last year’s actions may be found in the Annual Update Table. A report of the
Estimated Actual Percentages of Improved Services for last year’s actions may be found in the Contributing Actions Annual Update
Table.

Local Control and Accountability Plan Template Page 49 of 7
Year
Days
Enrolled
Days
Present
Percent Present
2016-2017 66726 62630 94%
2017-2018 68758 65310 95%
2018-2019 63352 59803 94%
2019-2020 45286 42536 94%
2020-2021 59957 55492 93%
Goals and Actions
Goal
Goal #
Description
[Goal 6]
Our school will maintain a minimum of 90% attendance rate for ASAM students.
An explanation of why the LEA has developed this goal.
Goal 6 areas of challenge include chronic absenteeism for the 2019 though the 2021 school year. Although we have had success with
suspensions this goals still needs to be heavily monitored.

Local Control and Accountability Plan Template Page 50 of 7
2020-21 Suspension Rate
W. E. B. DuBois Public Charter Report (10-76778-1030774)
Disaggregated by Ethnicity
Ethnicity
Cumulative
Enrollment
Total
Suspensions
Unduplicated
Count of
Students
Suspended
Suspension
Rate
Percent of
Students
Suspended
with One
Suspension
Percent of
Students
Suspended
with Multiple
Suspensions
Not Reported
*
*
*
*
*
*
Filipino
*
*
*
*
*
*
Pacific Islander
*
*
*
*
*
*
African American
66
0
0
0.0%
0.0%
0.0%
American Indian or Alaska Native
*
*
*
*
*
*
Asian
*
*
*
*
*
*
W.E.B. DuBois Public Charte
Suspension Rate
Year
Suspension
Rate
2013- 2014
10.10%
2014-2015
8.80%
2015- 2016
12.70%
2016- 2017
11.60%
2017-2018
5.20%
2018-2019
2.00%
2019- 2020
1.20%
2020-2021
0.03%

Local Control and Accountability Plan Template Page 51 of 7
Hispanic or Latino
290
1
1
0.3%
100.0%
0.0%
White
*
*
*
*
*
*
Two or More Races
*
*
*
*
*
*
Report Totals
Name
Cumulative
Enrollment
Total
Suspensions
Unduplicated
Count of
Students
Suspended
Suspension
Rate
Percent of
Students
Suspended
with One
Suspension
Percent of
Students
Suspended
with Multiple
Suspensions
W.E.B. DuBois Public Charter
373
1
1
0.3%
100.0%
0.0%
Washington Unified
3,062
11
11
0.4%
100.0%
0.0%
Fresno County
212,792
685
617
0.3%
91.1%
8.9%
Statewide
6,147,253
14,913
12,301
0.2%
86.2%
13.8%
2020-21 Chronic Absenteeism Rate
Race / Ethnicity
Chronic
Absenteeism
Eligible
Enrollment
Chronic
Absenteeism
Count
Chronic
Absenteeism
Rate
African American
65
16
24.6%
American Indian or Alaska Native
*
*
*
Asian
*
*
*
Filipino
*
*
*
Hispanic or Latino
287
64
22.3%
Pacific Islander
*
*
*

Local Control and Accountability Plan Template Page 52 of 7
White
*
*
*
Two or More Races
*
*
*
Not Reported
*
*
*
Measuring and Reporting Results
Metric Baseline Year 1 Outcome Year 2 Outcome Year 3 Outcome
Desired Outcome for
2023–24
Chronic
Absenteeism
Rate
Data year 2020-2021
Chronic
Data Source: Data
Quest, CALPADS
Absenteeism
Rate 22.5%
HIS 22.3%
AA 24.6%
Data year 2020-2021
Chronic
Data Source: Data
Quest, CALPADS
Absenteeism
Rate 22.5%
HIS 22.3%
AA 24.6%
Chronic Truancy will
decrease by 7%
HIS 11.3%
AA 14.6%
Attendance Rate for
DASS students
Data year 2020-21
93%
Data year 2020-21
93%
will maintain a
minimum of 90%
attendance rate for
DASS students
Suspension Rate of
students enrolled 90
days or more
Data year 2019-2020
1.2%
Data Source:DASH,
Data Quest
Data year 2020-2021
0.3%
Data Source:DASH,
Data Quest
will maintain a
minimum of 1.5%
decrease in
suspension rates

Local Control and Accountability Plan Template Page 53 of 7
Actions
Action #
Title
Description
Total Funds
Contributing
[Action 1] Overall attendance
Overall attendance for Special population (EL, Foster youth, Socio-
Disadvantage and Students with disabilities) will increase by 2% each year in
Attendance.
1.
Qualified dropout prevention and Attendance support staff to reduce loss of
learning.
a. Social Emotional Support PD
b. Academic Support Monitoring PD
c. Positive Culture and Environment PD
2.
Parent Involvement and Resources for community outreach and support.
a. Personal phone calls (truancy prevention)
b. Home visits (chronic absenteeism)
c. School messenger and text messenger (Automatic phone calls and
email
d. Mental Health contractors
3.
Provide attendance incentives.
a. Students with positive attendance were
entered into raffles and highlighted at break and in monthly newsletters.
b. Attendance Incentives Plan
• Daily, weekly, monthly, individual student incentives raffles
• Weekly school-wide incentives for meeting
(90% or above attendance rate)
c. MTSS/PBIS
d. Transportation (bussing) provided to all students
d. Increase student engagement
e. Monitor chronic absenteeism
4.
New methods were utilized to recruit students.
a. Website and social media Facebook page is
utilized to expand presence and connect with
potential enrollees. The Facebook has 134 followers and 5-star reviews.
$301,921
LCFF:
$270,669
ESSER III:
$31,252
Y
[Action #2]
Decrease Chronic Truancy
Chronic Truancy will decrease by 2% each year and by 6% by year 3.
Parent Involvement and Resources for community outreach and support.
a. Personal phone calls and text messenging (truancy prevention)
b. Home visits (chronic absenteeism)
$81,525
LCFF:
$81,525
Y

Local Control and Accountability Plan Template Page 54 of 7
Goal Analysis for [LCAP Year]
An analysis of how this goal was carried out in the previous year.
A description of any substantive differences in planned actions and actual implementation of these actions.
Our student attendance at school has decreased significantly with a 11.92% drop from the prior 2019 school year to 2020. In the 2021 school
year monthly data shows we are still heavily impacted by the Pandemic/COVID 19.
An explanation of material differences between Budgeted Expenditures and Estimated Actual Expenditures and/or Planned Percentages of
Improved Services and Estimated Actual Percentages of Improved Services.
Goal #6 dollars are increased by $34,980; W.E.B DuBois is estimated to be spending $382,987 earmarked for increasing student attendance
and lowering dropout rates. We have also increased the number of Student Support counselor for truancy prevention.
An explanation of how effective the specific actions were in making progress toward the goal.
Currently we have not had a significant change in attendance by our currently reinventing our MTSS support plans to reflect new and
innovative ways to keep our children in school.
A description of any changes made to the planned goal, metrics, desired outcomes, or actions for the coming year that resulted from reflections
on prior practice.
[None significant.
A report of the Total Estimated Actual Expenditures for last year’s actions may be found in the Annual Update Table. A report of the
Estimated Actual Percentages of Improved Services for last year’s actions may be found in the Contributing Actions Annual Update
Table.

Local Control and Accountability Plan Template Page 55 of 7
Goals and Actions
Goal
Goal #
Description
[Goal 7]
All students will have access to Career Pathways, Advanced Placement, and College Preparatory Course Options.
An explanation of why the LEA has developed this goal.
Each student is required before graduation to complete two CTE courses within chosen career pathway. Students are engaged in learning
industry standards and skills, though embedded technologies, and applied sciences. In addition, through our CTE courses students are
offered opportunities to advance academically through dual enrollment in college courses leading to a professional industry certificate or
Associate’s Degree while concurrently working on their High School Diploma. Recent data shows 81% of students are passing there CTE
courses with a C or better which exceeds are expected goal.
Measuring and Reporting Results
Metric Baseline Year 1 Outcome Year 2 Outcome Year 3 Outcome
Desired Outcome for
2023–24
CTE Pathways
enrollment/completion
Data year: 2020~
2021
Data Source: Aries
Students earned a C
or better in a
minimum of two
courses within a
career pathway/ CTE
sequence 81%
Data year: 2020~
2021
Data Source: Aries
Students earned a C
or better in a
minimum of two
courses within a
career pathway/ CTE
sequence 81%
The number of
students earning a C
or better in Career
Pathways will
increase by 1% per
year for a total of
85%.
Expand Career and
CTE Pathways for All
students
Data Year: 2021
Data Source: CTE
reports
0 expansion
Data Year: 2021
Data Source: CTE
reports
0 expansion
Expand Career
pathways and CTE
programs by 1 per
year based on
students’ needs, and/
or jobs in demand.

Local Control and Accountability Plan Template Page 56 of 7
Metric Baseline Year 1 Outcome Year 2 Outcome Year 3 Outcome
Desired Outcome for
2023–24
Student and Parent
Survey
Data year: 2021~
2022
Data Source: Student
Surveys
Student Surveys
expressing career
readiness satisfaction
90%
Data year: 2021~
2022
Data Source: Student
Surveys
Student Surveys
expressing career
readiness satisfaction
90%
Career readiness
survey satisfaction
will be at 93%
Actions
Action #
Title
Description
Total Funds
Contributing
[Action 1]
Expand Career pathways and
CTE programs
The school will expand Career pathways and CTE programs by 1 per year over
the next 3 years based on students’ needs and jobs in demand.
Dual Enrollment Programs
a. ACBS (CTE Pathway)
b. Other colleges such as 4 year programs
c. Edgenunity
d. Ongoing opportunities with new school partnerships are in the planning
phrase and moving to implementation
e. Implement paid internships for students and job shadowing opportunities
$218,983
LCFF:
$85,433
ESSER III:
$133,550
Y
[Action 1]
Expand Career pathways and
CTE programs
The school will expand Career pathways and CTE programs by 1 per year over
the next 3 years based on students’ needs and jobs in demand.
Dual Enrollment Programs
a. ACBS (CTE Pathway)
b. Other colleges such as 4 year programs
c. Edgenunity
d. Ongoing opportunities with new school partnerships are in the planning
phrase and moving to implementation
e. Implement paid internships for students and job shadowing opportunities
$150,293
LCFF:
$150,293
Y

Local Control and Accountability Plan Template Page 57 of 7
Action #
Title
Description
Total Funds
Contributing
[Action 3] Student and parents’ surveys
Student and parent surveys percentages will increase in career
readiness satisfaction will by 3% by year 2 or by 93 percentage in year
3. Focus groups will be conducted when above 10% dissatisfaction.
$107,629
$107,629
LCFF
Y
Goal Analysis for [LCAP Year]
An analysis of how this goal was carried out in the previous year.
A description of any substantive differences in planned actions and actual implementation of these actions.
[No substantial changes from prior actions
An explanation of material differences between Budgeted Expenditures and Estimated Actual Expenditures and/or Planned Percentages of
Improved Services and Estimated Actual Percentages of Improved Services.
Goal #7 dollars increased by $6,860; the re-alignment of dollars from other goals to this one is partially due to decreased attendance and a
reduction in LCFF dollars. W.E.B. DuBois Public Charter School is estimated to be spending $351,266 on these 3 actions earmarked for
implementation of dual credit partnerships, opportunities for career pathways students, and increasing student career training through
specialized training of our teachers.
An explanation of how effective the specific actions were in making progress toward the goal.
Due to the pandemic several actions were not able to be implemented. We will see more progress this coming year to report.
A description of any changes made to the planned goal, metrics, desired outcomes, or actions for the coming year that resulted from reflections
on prior practice.
[No substantial changes.
A report of the Total Estimated Actual Expenditures for last year’s actions may be found in the Annual Update Table. A report of the
Estimated Actual Percentages of Improved Services for last year’s actions may be found in the Contributing Actions Annual Update
Table.

Local Control and Accountability Plan Template Page 58 of 7
Goals and Actions
Goal
Goal #
Description
[Goal 8]
Students in our special education populations will make satisfactory progress towards H.S. graduation requirements.
An explanation of why the LEA has developed this goal.
Staff have worked diligently to graduate more students each year and increase the percentage of students graduating in special populations
such as students with disabilities, English learners, socio economically disadvantage, and students who are 18 years or older. Our Students
with disabilities have increase their graduation rate from the year 2020 to 2021 and are currently at 0%. Additionally, students that are socio
economically disadvantaged have increased their graduation rate by 96.0%
W.E.B. DuBois Credit Eligible Graduation Rate
Year
Credit
Eligible
Graduates
Drops
Credit Eligible Graduation Rate
2016-
2017
31
30
1
96.8%
2017-
2018
46
46
0
100.0%
2018-
2019
19
19
0
100.00%
2019-
2020
54
52
2
96.29%
2020-
2021
26
25
1
98%

Local Control and Accountability Plan Template Page 59 of 7
Dashboard Additional Report - DASS Graduation Rate
W.E.B. DuBois Public Charter (Fresno, CA)
Washington Unified
Reporting Year:
2021
This report displays graduation rates that were calculated using Dashboard rules. While this data is similar to the Four-Year Cohort data on
DataQuest, the data are not comparable. For the differences between this report and the reports on DataQuest, please refer to this data
crosswalk.
Read more about this report
Graduation Rate by Student Group
Student Group
Number of Students in the Graduation Rate
Number of Graduates
Graduation Rate
All Students
26
25
96.2%
English Learners
5
*
*
Foster Youth
1
*
*
Socioeconomically Disadvantaged
25
24
96.0%
Students with Disabilities
5
*
*
African American
1
*
*
Asian
1
*
*
Hispanic
23
22
95.7%
Two or More Races
1
*
*

Local Control and Accountability Plan Template Page 60 of 7
Measuring and Reporting Results
Metric Baseline Year 1 Outcome Year 2 Outcome Year 3 Outcome
Desired Outcome for
2023–24
Graduation Rate
Data year: 2020~
2021
Data Source: Data
Quest
W.E.B. DuBois
Graduation Rate is
96.2%
W.E.B. DuBois Credit
Eligible Graduation
Rate 98%
EL: 0%
FY:0%
LI: 96%
SPED: 0%
Data year: 2020~
2021
Data Source: Data
Quest
W.E.B. DuBois
Graduation Rate is
96.2%
W.E.B. DuBois Credit
Eligible Graduation
Rate 98%
EL: 0%
FY:0%
LI: 96%
SPED: 0%
Overall High school
graduation rate for 5-
year cohort will
increase above 97%
LI: 97%
Special Population
Data Year : 2020-
2021
Graduation rate for
Socioeconomically
Disadvantaged 74%
and Students with
Disabilities is 0%.
Data Year : 2020-
2021
Graduation rate for
Socioeconomically
Disadvantaged 74%
and Students with
Disabilities is 0%.
Overall High school
rate for 5- year
Cohort for special
populations will
increase by 3% for
Students with
disabilities, and Low
Income
LI: 77%

Local Control and Accountability Plan Template Page 61 of 7
Actions
Action #
Title
Description
Total Funds
Contributing
[Action 1]
Overall High school graduation
rate
1.Maintain partnership with sponsoring school district per Special Education
Arrangement.
a. W. E. B. DuBois has currently opted into the Washington Unified School District
Special Education Local Plan Area. DuBois retains the option to opt out of the SELPA
according to charter law.
2.Provide tutoring and support services outside of instructional time.
a. Tutoring and support services are available after school.
b. MTSS/PBIS
c. Support and Supplement material for Common Core and EL standards
d. Instructional support for all teachers and staff
3.Contract with the school district or other service providers to ensure that student
assessment and IEP compliance is maintained.
4.Core classroom instruction will support the needs of students with disabilities.
a. Teachers will ensure that all modifications and interventions are implemented as
outlined in the IEP for students with disabilities.
b. Ed. Coordinators providing support and coaching.
c. Monitor student performance and achievement
5. CSI plan incorporation ensuring on-time graduation.
$174,802
$174,802
Y

Local Control and Accountability Plan Template Page 62 of 7
Action #
Title
Description
Total Funds
Contributing
[Action 2] Students in Special population
Students in special populations including foster youth, students with
disabilities, English Learners, and identified significant groups such as
Hispanic and African American will increase toward graduation by 2%
each year.
1.Maintain a homeless/foster youth liaison to ensure program
compliance with applicable state and federal laws.
a. A homeless/foster youth liaison has been identified and is responsible
for ensuring program compliance.
2.Provide professional learning opportunities for support staff to ensure
support for homeless and foster youth students.
3.Develop additional referral resources.
a. Produce resources in multiple languages.
b. Information will be mailed regularly as well as placed in multiple
locations throughout the campus
$4,268
LCFF:
$4,268
Y
2020-21 Five-Year and 2019-20 Four-Year Cohort Graduation Rate Comparison
Race / Ethnicity
Cohort Students
Cohort Graduates
Cohort Graduation Rates
2019-20 Four-
Year Cohort
Students
2020-21 Five-
Year Cohort
Students
2019-20 Four-
Year
Graduates
2020-21 Five-
Year
Graduates
2019-20 Four-
Year
Graduation
Rate
2020-21 Five-
Year
Graduation
Rate
African American
*
*
*
*
*
*
American Indian or Alaska Native
*
*
*
*
*
*
Asian
*
*
*
*
*
*
Filipino
*
*
*
*
*
*

Local Control and Accountability Plan Template Page 63 of 7
Hispanic or Latino
35
35
26
26
74.3%
74.3%
Pacific Islander
*
*
*
*
*
*
White
*
*
*
*
*
*
Two or More Races
*
*
*
*
*
*
Not Reported
*
*
*
*
*
*
Report Totals
Name
Cohort Students
Cohort Graduates
Cohort Graduation Rates
2019-20 Four-
Year Cohort
Students
2020-21 Five-
Year Cohort
Students
2019-20 Four-
Year
Graduates
2020-21 Five-
Year
Graduates
2019-20 Four-
Year
Graduation
Rate
2020-21 Five-
Year
Graduation
Rate
W.E.B. DuBois Public Charter
43
43
32
32
74.4%
74.4%
Washington Unified
338
338
308
307
91.1%
90.8%
Fresno
15,458
15,461
12,407
13,141
80.3%
85.0%
State
491,773
491,930
414,193
429,386
84.2%
87.3%
Goal Analysis for [LCAP Year]
An analysis of how this goal was carried out in the previous year.
A description of any substantive differences in planned actions and actual implementation of these actions.
W.E.B DuBois Public Charter School staff have worked diligently to graduate more students each year and increase the percentage of
students graduating in special populations such as students with disabilities, English learners, socio economically disadvantage, and
students who are 18 years or older.. Additionally, students that are socio economically disadvantaged have increased their graduation rate
by 14.2+ with a rate of 96%.

Local Control and Accountability Plan Template Page 64 of 7
An explanation of material differences between Budgeted Expenditures and Estimated Actual Expenditures and/or Planned Percentages of
Improved Services and Estimated Actual Percentages of Improved Services.
Goal #8 dollars are increased by $2,462 due to ensuring that Special Needs students are being met and are receiving the specialized care
according to their IEPs including intervention and specialized education plans tailored to each student’s individual needs.
An explanation of how effective the specific actions were in making progress toward the goal.
Thus far this is DuBois’ most effective achievement in the past 2 years. We have also lowered the credit threshold for students over 18 which
has assisted the school in contributing to a higher graduation rate.
A description of any changes made to the planned goal, metrics, desired outcomes, or actions for the coming year that resulted from reflections
on prior practice.
No changes at this time as best practices are working.
A report of the Total Estimated Actual Expenditures for last year’s actions may be found in the Annual Update Table. A report of the
Estimated Actual Percentages of Improved Services for last year’s actions may be found in the Contributing Actions Annual Update
Table.

Local Control and Accountability Plan Template Page 65 of 7
Increased or Improved Services for Foster Youth, English Learners, and Low-
Income Students for [LCAP Year]
Projected LCFF Supplemental and/or Concentration Grants Projected Additional LCFF Concentration Grant (15 percent)
$1,294,858 $171,745
Required Percentage to Increase or Improve Services for the LCAP Year
Projected Percentage to Increase or
Improve Services for the Coming
School Year
LCFF Carryover — Percentage LCFF Carryover — Dollar
Total Percentage to Increase or
Improve Services for the Coming
School Year
41.32% 0% $0 41.32%
The Budgeted Expenditures for Actions identified as Contributing may be found in the Contributing Actions Table.
Required Descriptions
For each action being provided to an entire school, or across the entire school district or county office of education (COE), an explanation of (1)
how the needs of foster youth, English learners, and low-income students were considered first, and (2) how these actions are effective in
meeting the goals for these students.
All services are being provided school wide according to our SPSA Plan as we are a schoolwide program and we are 94% free and reduced
lunch. Specialized services are provided to English Learners in accordance with our EL plan. Students with special needs are provided
services and accommodation according to their IEP using in person and on-site learning opportunities. Foster Youth and homeless students
are also provided in person one to one learning opportunities twice a week and daily online instruction. Counselors have prioritized students
with special needs in order to ensure they are receiving the proper resources and referrals needed.
A description of how services for foster youth, English learners, and low-income students are being increased or improved by the percentage
required.
Services are improving for each special populations that is considered to have significant numbers according to the state. Our data from
DASHBoard, DATA Quest and Surveys reflect the improvements in each of the goals it applies to including our graduation rate, Career
Pathways, and Academic ELA data.
A description of the plan for how the additional concentration grant add-on funding identified above will be used to increase the number of staff
providing direct services to students at schools that have a high concentration (above 55 percent) of foster youth, English learners, and low-
income students, as applicable.
Local Control and Accountability Plan Template Page 66 of 7
Currently, we have used the funding to increase the number of student support counselors, coordinators, substitute tutors and to attract
highly qualified teachers and bus drivers.
Staff-to-student ratios
by type of school and
concentration of
unduplicated students
Schools with a student concentration of 55 percent or less
Schools with a student concentration of greater than 55
percent
Staff-to-student ratio of
classified staff providing
direct services to
students
[n/a 1 to 20
Staff-to-student ratio of
certificated staff providing
direct services to
students
[n/a 1 to 20

Local Control and Accountability Plan Template Page 67 of 7
2021-22 Total Planned Expenditures Table
Totals LCFF Funds Other State Funds Local Funds Federal Funds Total Funds Total Personnel Total Non-personnel
Totals
2,851,130$ 385,971$ 7,500$ 862,980$ 4
,107,581 3,578,582$ 528,999$
Goal # Action # Action Title Student Group(s) LCFF Funds Other State Funds Local Funds Federal Funds Total Funds
1 1 Intervention Schoolwide $ 915,330 $ 280,245 $ - $ 257,470 $ 1,453,045
1 2 Recruit High Quality Teachers Schoolwide $ 98,785 $ - $ 7,500 $ 100,000 $ 206,285
2 1
English Language Learners Instructional
Strategies
Schoolwide $ 81,572 $ 16,084 $ - $ 416,114 $ 513,770
3 1 Teacher Professional Development Schoolwide $ 200,290 $ - $ - $ 17,396 $ 217,686
4 1 Increase Parent Involvement ELL Students $ 24,182 $ - $ - $ - $ 24,182
5 1 Safe High Quality Facilities ELL Students $ 659,349 $ 89,642 $ - $ - $ 748,991
6 1
Increase Atttendance & Lower Dropout
Rates
Schoolwide $ 348,007 $ - $ - $ - $ 348,007
7 1 Implement Dual Credit Partnerships Schoolwide $ 94,456 $ - $ - $ - $ 94,456
7 2
Recruitment of Partners To Increase
Opportunities for Career Pathways
Schoolwide $ 173,450 $ - $ - $ 72,000 $ 245,450
7 3
Workbase Learning Professional
Development of Teachers
Schoolwide $ 4,500 $ - $ - $ - $ 4,500
8 1 Base: Special Education Schoolwide $ 169,054 $ - $ - $ - $ 169,054
8 2 Foster/Homeless Liason Schoolwide $ 82,155 $ - $ - $ - $ 82,155

Local Control and Accountability Plan Template Page 68 of 7
2021-22 Contributing Actions Table
1.
Projected
LCFF Base
Grant
2. Projected
LCFF
Supplement
al and/or
Concentrati
on Grants
3. Projected Percentage to Increase or Improve Services for the Coming
School Year
(2 divided by 1)
LCFF Carryover —
Percentage
(Percentage from
Prior Year)
Total Percentage to
Increase or Improve
Services for the
Coming School Year
(3 + Carryover %)
4. Total Planned
Contributing
Expenditures
(LCFF Funds)
5. Total Planned
Percentage of
Improved Services
(%)
Planned Percentage
to Increase or
Improve Services
for the Coming
School Year
(4 divided by 1, plus
5)
Totals by
Type
Total LCFF
Funds
2,975,033$ 1,237,986$ 41.61% 0.00% 41.61% 2,851,130$ 24.00% 119.84%
Total:
2,851,130$
LEA-wide
-$
Limited
200,290$
Schoolwide
1,967,309$
Goal # Action # Action Title
Contributing to
Increased or
Improved Services?
Scope
Unduplicated
Student Group(s)
Location
Planned
Expenditures for
Contributing Actions
(LCFF Funds)
Planned
Percentage
of Improved
Services (%)
1 1 Intervention
Yes Schoolwide N/A Schoolwide 915,330$ 2.00%
1 2 Recruit High Quality Teachers
Yes Schoolwide N/A Schoolwide 98,785$ 2.00%
2 1 English Language Learners Instructional Strategies
Yes Schoolwide N/A Schoolwide 81,572$ 2.00%
3 1 Teacher Professional Development
Yes Limited N/A Schoolwide 200,290$ 2.00%
4 1 Increase Parent Involvement
Yes [Input scope]
English Learners
and Low-Income
Schoolwide 24,182$ 2.00%
5 1 Safe High Quality Facilities
Yes [Input scope] English Learners Schoolwide 659,349$ 2.00%
6 1 Increase Atttendance & Lower Dropout Rates
Yes Schoolwide N/A Schoolwide 348,007$ 2.00%
7 1 Implement Dual Credit Partnerships
Yes Schoolwide N/A Schoolwide 94,456$ 2.00%
7 2 Recruitment of Partners To Increase Opportunities for Career Pathways Students
Yes Schoolwide N/A Schoolwide 173,450$ 2.00%
7 3 Workbase Learning Professional Development of Teachers
Yes Schoolwide N/A Schoolwide 4,500$ 3.00%
8 1 Base: Special Education
Yes Schoolwide N/A Schoolwide 169,054$ 1.00%
8 2 Foster/Homeless Liason
Yes Schoolwide N/A Schoolwide 82,155$ 2.00%

Local Control and Accountability Plan Template Page 69 of 7
2021-22 Annual Update Table
Totals:
Last Year's
Total Planned
Expenditures
(Total Funds)
Total Estimated Actual Expenditures
(Total Funds)
Totals:
4,107,581.00$ 5,100,903.00$
Last
Year's
Goal #
Last Year's
Action #
Prior Action/Service Title
Contributed to
Increased or
Improved
Services?
Last Year's
Planned
Expenditures
(Total Funds)
Estimated Actual
Expenditures
(Input Total
Funds)
1 1 Intervention Yes $ 1,453,045 $ 2,168,555
1 2 Recruit High Quality Teachers Yes $ 206,285
$ 217,825
2 1
English Language Learners Instructional
Strategies
Yes $ 513,770 $ 512,999
3 1 Teacher Professional Development Yes $ 217,686 $ 207,306
4 1 Increase Parent Involvement Yes $ 24,182 $ 23,751
5 1
Safe High Quality Facilities Yes $ 748,991 $ 982,543
6 1 Increase Atttendance & Lower Dropout Rates Yes $ 348,007 $ 382,987
7 1
Implement Dual Credit Partnerships Yes $ 94,456 $ 97,592
7 2
Recruitment of Partners To Increase
Opportunities for Career Pathways Students
Yes $ 245,450 $ 248,982
7 3
Workbase Learning Professional Development
of Teachers
Yes $ 4,500 $ 4,692
8 1 Base: Special Education Yes $ 169,054 $ 170,711
8 2 Foster/Homeless Liason Yes $ 82,155 $ 82,960

Local Control and Accountability Plan Template Page 70 of 7
2021-22 Contributing Actions Annual Update Table
6.
Estimated
Actual LCFF
Supplement
al and/or
Concentrati
on Grants
(Input
4. Total
Planned
Contributing
Expenditures
(LCFF Funds)
7. Total Estimated Actual Expenditures
for Contributing Actions
(LCFF Funds)
Difference Between
Planned and Estimated
Actual Expenditures
for Contributing
Actions
(Subtract 7 from 4)
5. Total Planned
Percentage of Improved
Services (%)
8. Total Estimated
Actual Percentage of
Improved Services
(%)
Difference
Between
Planned and
Estimated
Actual
Percentage of
Improved
Services
1,244,877$ 2,851,130$ 3,908,431$ (1,057,301)$ 24.00% 24.00%
0.00% - No
Difference
Last Year's
Goal #
Last Year's
Action #
Prior Action/Service Title
Contributed to
Increased or Improved
Services?
Last Year's Planned
Expenditures for
Contributing Actions
(LCFF Funds)
Estimated Actual
Expenditures for
Contributing Actions
(Input LCFF Funds)
Planned
Percentage of
Improved
Services
Estimated Actual
Percentage of
Improved
Services
(Input
Percentage)
1 1 Intervention Yes 915,330$
816,192.00$
2.00% 2.00%
1 2 Recruit High Quality Teachers Yes 98,785$
499,678.00$
2.00% 2.00%
2 1
English Language Learners Instructional
Strategies
Yes 81,572$
623,679.00$
2.00% 2.00%
3 1 Teacher Professional Development Yes 200,290$
187,577.00$
2.00% 2.00%
4 1 Increase Parent Involvement Yes 24,182$
23,751.00$
2.00% 2.00%
5 1 Safe High Quality Facilities Yes 659,349$
799,020.00$
2.00% 2.00%
6 1
Increase Atttendance & Lower Dropout
Rates
Yes 348,007$
553,555.00$
2.00% 2.00%
7 1 Implement Dual Credit Partnerships Yes 94,456$
82,624.00$
2.00% 2.00%
7 2
Recruitment of Partners To Increase
Opportunities for Career Pathways
Students
Yes 173,450$
145,351.00$
2.00% 2.00%
7 3
Workbase Learning Professional
Development of Teachers
Yes 4,500$
3,800.00$
3.00% 3.00%
8 1 Base: Special Education Yes 169,054$
169,054.00$
1.00% 1.00%
8 2 Foster/Homeless Liason Yes 82,155$
4,150.00$
2.00% 2.00%

Local Control and Accountability Plan Template Page 71 of 7
2022-23 Total Planned Expenditures Table
Totals LCFF Funds Other State Funds Local Funds Federal Funds Total Funds Total Personnel
Total Non-
personnel
Totals
4,169,248$ 517,474$ 8,279$ 881,697$ 5,576,698 3,824,179$ 1,752,519$
Goal # Action # Action Title Student Group(s) LCFF Funds
Other State
Funds
Local Funds Federal Funds Total Funds
1 1 Intervention Schoolwide $ 1,396,252 $ 338,765 $ - $ 555,846 $ 2,290,863
1 2 Mathematics Performance Increase Schoolwide $ 516,641 $ 93,627 $ 8,279 $ 20,071 $ 638,618
1 3
Overall Academic Student Performance
Increase
Schoolwide $ 99,892 $ - $ - $ - $ 99,892
2 1 Student Engagement Middle School Schoolwide $ 550,008 $ 18,383 $ - $ - $ 568,391
2 2
English Language Learners Instructional
Strategies
ELL Students $ 48,987 $ - $ - $ - $ 48,987
2 3
English Language Students Will Complete
ELPAC Exam
ELL Students $ 45,889 $ - $ - $ - $ 45,889
3 1 Teacher Professional Development Schoolwide $ 128,255 $ - $ - $ 6,178 $ 134,433
3 2 Aspiring Administrators Schoolwide $ - $ - $ - $ 14,800 $ 14,800
3 3 Teacher and Administrator Workshop Schoolwide $ 80,500 $ - $ - $ - $ 80,500
4 1 Increase in Parent Involvement Schoolwide $ 19,309 $ - $ - $ - $ 19,309
4 2 Increase Parent Survey Satisfaction Schoolwide $ 5,250 $ - $ - $ - $ 5,250
5 1 Increase in Clubs and Sports for Students Schoolwide $ 17,676 $ 66,699 $ - $ - $ 84,375
5 2 Increase Student Activities Schoolwide $ - $ - $ - $ 70,500 $ 70,500
5 3
Safe Facilities and Restroom Facilities and
Eating Areas
Schoolwide $ 385,970 $ - $ - $ 49,500 $ 435,470
6 1 Overall Attendance Schoolwide $ 270,669 $ - $ - $ 31,252 $ 301,921
6 2 Decrease Chronic Truancy Schoolwide $ 81,525 $ - $ - $ - $ 81,525
7 1
Expand Career Pathways and CTE
Programs
Schoolwide $ 85,433 $ - $ - $ 133,550 $ 218,983
7 2
Passing Students for Career Pathway
Courses
Schoolwide $ 150,293 $ - $ - $ - $ 150,293
7 3 Student and Parents' Surveys Schoolwide $ 107,629 $ - $ - $ - $ 107,629
8 1
Increase in Overall High School
Graduation Rate
Schoolwide $ 174,802 $ - $ - $ - $ 174,802
8 2 Students in Special Population EL, Low-Income $ 4,268 $ - $ - $ - $ 4,268
Local Control and Accountability Plan Template Page 72 of 7

Local Control and Accountability Plan Template Page 73 of 7
2022-23 Contributing Actions Table
1. Projected
LCFF Base
Grant
2. Projected
LCFF
Supplemental
and/or
Concentration
Grants
3. Projected Percentage to Increase or Improve
Services for the Coming School Year
(2 divided by 1)
LCFF Carryover —
Percentage
(Percentage from Prior
Year)
Total Percentage to
Increase or Improve
Services for the
Coming School Year
(3 + Carryover %)
4. Total Planned
Contributing Expenditures
(LCFF Funds)
5. Total Planned
Percentage of
Improved Services
(%)
Planned Percentage to
Increase or Improve
Services for the
Coming School Year
(4 divided by 1, plus 5)
Totals by Type
Total LCFF
Funds
3,429,923
$ 1,398,516$ 40.77% 0.00% 40.77% 4,169,248$ 42.00% 163.56%
Total:
4,169,248$
LEA-wide Total:
-$
Limited Total:
554,276$
Schoolwide
3,520,096$
Goal # Action # Action Title
Contributing to
Increased or Improved
Services?
Scope
Unduplicated Student
Group(s)
Location
Planned Expenditures
for Contributing
Actions (LCFF Funds)
Planned
Percentage of
Improved
Services (%)
1 1 Intervention
Yes
Schoolwide N/A Schoolwide 1,396,252$ 2.00%
1 2 Mathematics Performance Increase
Yes
Schoolwide N/A Schoolwide 516,641$ 2.00%
1 3 Overall Academic Student Performance Increase
Yes Schoolwide N/A Schoolwide 99,892$ 2.00%
2
1 Student Engagement Middle School
Yes
Limited N/A Schoolwide 550,008$ 2.00%
2
2 English Language Learners Instructional Strategies
Yes
[Input scope]
English Learners and Low-
Income
Schoolwide 48,987$ 2.00%
2 3 English Language Students Will Complete ELPAC Exam
Yes [Input scope] English Learners Schoolwide 45,889$ 2.00%
3 1 Teacher Professional Development
Yes
Schoolwide N/A Schoolwide 128,255$ 2.00%
3 2 Aspiring Administrators
Yes
Schoolwide N/A Schoolwide -$ 2.00%
3
3 Teacher and Administrator Workshop
Yes Schoolwide N/A Schoolwide 80,500$ 2.00%
4 1 Increase in Parent Involvement
Yes Schoolwide N/A Schoolwide 19,309$ 3.00%
4
2 Increase Parent Survey Satisfaction
Yes Schoolwide N/A Schoolwide 5,250$ 1.00%
5 1 Increase in Clubs and Sports for Students
Yes Schoolwide N/A Schoolwide 17,676$ 2.00%
5 2 Increase Student Activities
Yes Schoolwide N/A Schoolwide -$ 2.00%
5 3 Safe Facilities and Restroom Facilities and Eating Areas
Yes
Schoolwide N/A Schoolwide 385,970$ 2.00%
6 1 Overall Attendance
Yes Schoolwide N/A Schoolwide 270,669$ 2.00%
6 2 Decrease Chronic Truancy
Yes Schoolwide N/A Schoolwide 81,525$ 2.00%
7 1 Expand Career Pathways and CTE Programs
Yes Schoolwide N/A Schoolwide 85,433$ 1.00%
7 2 Passing Students for Career Pathway Courses
Yes Schoolwide N/A Schoolwide 150,293$ 2.00%
7 3 Student and Parents' Surveys
Yes Schoolwide N/A Schoolwide 107,629$ 3.00%
8 1 Increase in Overall High School Graduation Rate
Yes Schoolwide N/A Schoolwide 174,802$ 2.00%
8 2 Students in Special Population
Yes Limited All Schoolwide 4,268$ 2.00%

Local Control and Accountability Plan Instructions Page 1 of 23
Instructions
Plan Summary
Engaging Educational Partners
Goals and Actions
Increased or Improved Services for Foster Youth, English Learners, and Low-Income Students
For additional questions or technical assistance related to the completion of the Local Control and Accountability Plan (LCAP) template, please
contact the local county office of education (COE), or the California Department of Education’s (CDE’s) Local Agency Systems Support Office,
by phone at 916-319-0809 or by email at lcf[email protected]ov.
Introduction and Instructions
The Local Control Funding Formula (LCFF) requires local educational agencies (LEAs) to engage their local educational partners in an annual
planning process to evaluate their progress within eight state priority areas encompassing all statutory metrics (COEs have 10 state priorities).
LEAs document the results of this planning process in the LCAP using the template adopted by the State Board of Education.
The LCAP development process serves three distinct, but related functions:
• Comprehensive Strategic Planning: The process of developing and annually updating the LCAP supports comprehensive strategic
planning (California Education Code [EC] Section 52064[e][1]). Strategic planning that is comprehensive connects budgetary decisions to
teaching and learning performance data. LEAs should continually evaluate the hard choices they make about the use of limited
resources to meet student and community needs to ensure opportunities and outcomes are improved for all students.
• Meaningful Engagement of Educational Partners: The LCAP development process should result in an LCAP that reflects decisions
made through meaningful engagement (EC Section 52064[e][1]). Local educational partners possess valuable perspectives and insights
about an LEA's programs and services. Effective strategic planning will incorporate these perspectives and insights in order to identify
potential goals and actions to be included in the LCAP.
• Accountability and Compliance: The LCAP serves an important accountability function because aspects of the LCAP template require
LEAs to show that they have complied with various requirements specified in the LCFF statutes and regulations, most notably:
o Demonstrating that LEAs are increasing or improving services for foster youth, English learners, and low-income students in
proportion to the amount of additional funding those students generate under LCFF (EC Section 52064[b][4-6]).
o Establishing goals, supported by actions and related expenditures, that address the statutory priority areas and statutory metrics
(EC sections 52064[b][1] and [2]).
Local Control and Accountability Plan Instructions Page 2 of 23
o Annually reviewing and updating the LCAP to reflect progress toward the goals (EC Section 52064[b][7]).
The LCAP template, like each LEA’s final adopted LCAP, is a document, not a process. LEAs must use the template to memorialize the
outcome of their LCAP development process, which should: (a) reflect comprehensive strategic planning (b) through meaningful engagement
with educational partners that (c) meets legal requirements, as reflected in the final adopted LCAP. The sections included within the LCAP
template do not and cannot reflect the full development process, just as the LCAP template itself is not intended as a tool for engaging
educational partners.
If a county superintendent of schools has jurisdiction over a single school district, the county board of education and the governing board of the
school district may adopt and file for review and approval a single LCAP consistent with the requirements in EC sections 52060, 52062, 52066,
52068, and 52070. The LCAP must clearly articulate to which entity’s budget (school district or county superintendent of schools) all budgeted
and actual expenditures are aligned.
The revised LCAP template for the 2021–22, 2022–23, and 2023–24 school years reflects statutory changes made through Assembly Bill 1840
(Committee on Budget), Chapter 243, Statutes of 2018. These statutory changes enhance transparency regarding expenditures on actions
included in the LCAP, including actions that contribute to meeting the requirement to increase or improve services for foster youth, English
learners, and low-income students, and to streamline the information presented within the LCAP to make adopted LCAPs more accessible for
educational partners and the public.
At its most basic, the adopted LCAP should attempt to distill not just what the LEA is doing for students in transitional kindergarten through
grade twelve (TK–12), but also allow educational partners to understand why, and whether those strategies are leading to improved
opportunities and outcomes for students. LEAs are strongly encouraged to use language and a level of detail in their adopted LCAPs intended
to be meaningful and accessible for the LEA’s diverse educational partners and the broader public.
In developing and finalizing the LCAP for adoption, LEAs are encouraged to keep the following overarching frame at the forefront of the
strategic planning and educational partner engagement functions:
Given present performance across the state priorities and on indicators in the California School Dashboard (Dashboard), how is the LEA
using its budgetary resources to respond to TK–12 student and community needs, and address any performance gaps, including by
meeting its obligation to increase or improve services for foster youth, English learners, and low-income students?
LEAs are encouraged to focus on a set of metrics and actions that the LEA believes, based on input gathered from educational partners,
research, and experience, will have the biggest impact on behalf of its TK–12 students.
These instructions address the requirements for each section of the LCAP, but may include information about effective practices when
developing the LCAP and completing the LCAP itself. Additionally, information is included at the beginning of each section emphasizing the
purpose that each section serves.

Local Control and Accountability Plan Instructions Page 3 of 23
Plan Summary
Purpose
A well-developed Plan Summary section provides a meaningful context for the LCAP. This section provides information about an LEA’s
community as well as relevant information about student needs and performance. In order to provide a meaningful context for the rest of the
LCAP, the content of this section should be clearly and meaningfully related to the content included in the subsequent sections of the LCAP.
Requirements and Instructions
General Information – Briefly describe the LEA, its schools, and its students in grades TK–12, as applicable to the LEA. For example,
information about an LEA in terms of geography, enrollment, or employment, the number and size of specific schools, recent community
challenges, and other such information as an LEA wishes to include can enable a reader to more fully understand an LEA’s LCAP.
Reflections: Successes – Based on a review of performance on the state indicators and local performance indicators included in the
Dashboard, progress toward LCAP goals, local self-assessment tools, input from educational partners, and any other information, what
progress is the LEA most proud of and how does the LEA plan to maintain or build upon that success? This may include identifying specific
examples of how past increases or improvements in services for foster youth, English learners, and low-income students have led to improved
performance for these students.
Reflections: Identified Need – Referring to the Dashboard, identify: (a) any state indicator for which overall performance was in the “Red” or
“Orange” performance category or any local indicator where the LEA received a “Not Met” or “Not Met for Two or More Years” rating AND (b)
any state indicator for which performance for any student group was two or more performance levels below the “all student” performance. What
steps is the LEA planning to take to address these areas of low performance and performance gaps? An LEA that is required to include a goal
to address one or more consistently low-performing student groups or low-performing schools must identify that it is required to include this goal
and must also identify the applicable student group(s) and/or school(s). Other needs may be identified using locally collected data including
data collected to inform the self-reflection tools and reporting local indicators on the Dashboard.
LCAP Highlights – Identify and briefly summarize the key features of this year’s LCAP.
Comprehensive Support and Improvement – An LEA with a school or schools identified for comprehensive support and improvement (CSI)
under the Every Student Succeeds Act must respond to the following prompts:
● Schools Identified: Identify the schools within the LEA that have been identified for CSI.
● Support for Identified Schools: Describe how the LEA has or will support the identified schools in developing CSI plans that included a
school-level needs assessment, evidence-based interventions, and the identification of any resource inequities to be addressed through
the implementation of the CSI plan.

Local Control and Accountability Plan Instructions Page 4 of 23
● Monitoring and Evaluating Effectiveness: Describe how the LEA will monitor and evaluate the implementation and effectiveness of the
CSI plan to support student and school improvement.
Engaging Educational Partners
Purpose
Significant and purposeful engagement of parents, students, educators, and other educational partners, including those representing the
student groups identified by LCFF, is critical to the development of the LCAP and the budget process. Consistent with statute, such
engagement should support comprehensive strategic planning, accountability, and improvement across the state priorities and locally identified
priorities (EC Section 52064[e][1]). Engagement of educational partners is an ongoing, annual process.
This section is designed to reflect how the engagement of educational partners influenced the decisions reflected in the adopted LCAP. The
goal is to allow educational partners that participated in the LCAP development process and the broader public understand how the LEA
engaged educational partners and the impact of that engagement. LEAs are encouraged to keep this goal in the forefront when completing this
section.
Statute and regulations specify the educational partners that school districts and COEs must consult when developing the LCAP: teachers,
principals, administrators, other school personnel, local bargaining units of the LEA, parents, and students. Before adopting the LCAP, school
districts and COEs must share it with the Parent Advisory Committee and, if applicable, to its English Learner Parent Advisory Committee. The
superintendent is required by statute to respond in writing to the comments received from these committees. School districts and COEs must
also consult with the special education local plan area administrator(s) when developing the LCAP.
Statute requires charter schools to consult with teachers, principals, administrators, other school personnel, parents, and students in developing
the LCAP. The LCAP should also be shared with, and LEAs should request input from, schoolsite-level advisory groups, as applicable (e.g.,
schoolsite councils, English Learner Advisory Councils, student advisory groups, etc.), to facilitate alignment between schoolsite and district-
level goals and actions.
Information and resources that support effective engagement, define student consultation, and provide the requirements for advisory group
composition, can be found under Resources on the following web page of the CDE’s website: https://www.cde.ca.gov/re/lc/.
Requirements and Instructions
Below is an excerpt from the 2018–19 Guide for Annual Audits of K–12 Local Education Agencies and State Compliance Reporting, which is
provided to highlight the legal requirements for engagement of educational partners in the LCAP development process:
Local Control and Accountability Plan:
For county offices of education and school districts only, verify the LEA:
Local Control and Accountability Plan Instructions Page 5 of 23
a) Presented the local control and accountability plan to the parent advisory committee in accordance with Education Code section
52062(a)(1) or 52068(a)(1), as appropriate.
b) If applicable, presented the local control and accountability plan to the English learner parent advisory committee, in accordance
with Education Code section 52062(a)(2) or 52068(a)(2), as appropriate.
c) Notified members of the public of the opportunity to submit comments regarding specific actions and expenditures proposed to be
included in the local control and accountability plan in accordance with Education Code section 52062(a)(3) or 52068(a)(3), as
appropriate.
d) Held at least one public hearing in accordance with Education Code section 52062(b)(1) or 52068(b)(1), as appropriate.
e) Adopted the local control and accountability plan in a public meeting in accordance with Education Code section 52062(b)(2) or
52068(b)(2), as appropriate.
Prompt 1: “A summary of the process used to engage educational partners and how this engagement was considered before finalizing the
LCAP.”
Describe the engagement process used by the LEA to involve educational partners in the development of the LCAP, including, at a minimum,
describing how the LEA met its obligation to consult with all statutorily required educational partners as applicable to the type of LEA. A
sufficient response to this prompt must include general information about the timeline of the process and meetings or other engagement
strategies with educational partners. A response may also include information about an LEA’s philosophical approach to engaging its
educational partners.
Prompt 2: “A summary of the feedback provided by specific educational partners.”
Describe and summarize the feedback provided by specific educational partners. A sufficient response to this prompt will indicate ideas, trends,
or inputs that emerged from an analysis of the feedback received from educational partners.
Prompt 3: “A description of the aspects of the LCAP that were influenced by specific input from educational partners.”
A sufficient response to this prompt will provide educational partners and the public with clear, specific information about how the engagement
process influenced the development of the LCAP. The response must describe aspects of the LCAP that were influenced by or developed in
response to the educational partner feedback described in response to Prompt 2. This may include a description of how the LEA prioritized
requests of educational partners within the context of the budgetary resources available or otherwise prioritized areas of focus within the LCAP.
For the purposes of this prompt, “aspects” of an LCAP that may have been influenced by educational partner input can include, but are not
necessarily limited to:
• Inclusion of a goal or decision to pursue a Focus Goal (as described below)

Local Control and Accountability Plan Instructions Page 6 of 23
• Inclusion of metrics other than the statutorily required metrics
• Determination of the desired outcome on one or more metrics
• Inclusion of performance by one or more student groups in the Measuring and Reporting Results subsection
• Inclusion of action(s) or a group of actions
• Elimination of action(s) or group of actions
• Changes to the level of proposed expenditures for one or more actions
• Inclusion of action(s) as contributing to increased or improved services for unduplicated students
• Determination of effectiveness of the specific actions to achieve the goal
• Determination of material differences in expenditures
• Determination of changes made to a goal for the ensuing LCAP year based on the annual update process
• Determination of challenges or successes in the implementation of actions
Goals and Actions
Purpose
Well-developed goals will clearly communicate to educational partners what the LEA plans to accomplish, what the LEA plans to do in order to
accomplish the goal, and how the LEA will know when it has accomplished the goal. A goal statement, associated metrics and expected
outcomes, and the actions included in the goal should be in alignment. The explanation for why the LEA included a goal is an opportunity for
LEAs to clearly communicate to educational partners and the public why, among the various strengths and areas for improvement highlighted
by performance data and strategies and actions that could be pursued, the LEA decided to pursue this goal, and the related metrics, expected
outcomes, actions, and expenditures.
A well-developed goal can be focused on the performance relative to a metric or metrics for all students, a specific student group(s), narrowing
performance gaps, or implementing programs or strategies expected to impact outcomes. LEAs should assess the performance of their student
groups when developing goals and the related actions to achieve such goals.
Requirements and Instructions
LEAs should prioritize the goals, specific actions, and related expenditures included within the LCAP within one or more state priorities. LEAs
should consider performance on the state and local indicators, including their locally collected and reported data for the local indicators that are
included in the Dashboard in determining whether and how to prioritize its goals within the LCAP.
In order to support prioritization of goals, the LCAP template provides LEAs with the option of developing three different kinds of goals:
• Focus Goal: A Focus Goal is relatively more concentrated in scope and may focus on a fewer number of metrics to measure
improvement. A Focus Goal statement will be time bound and make clear how the goal is to be measured.
Local Control and Accountability Plan Instructions Page 7 of 23
• Broad Goal: A Broad Goal is relatively less concentrated in its scope and may focus on improving performance across a wide range of
metrics.
• Maintenance of Progress Goal: A Maintenance of Progress Goal includes actions that may be ongoing without significant changes and
allows an LEA to track performance on any metrics not addressed in the other goals of the LCAP.
At a minimum, the LCAP must address all LCFF priorities and associated metrics.
Focus Goal(s)
Goal Description: The description provided for a Focus Goal must be specific, measurable, and time bound. An LEA develops a Focus Goal to
address areas of need that may require or benefit from a more specific and data intensive approach. The Focus Goal can explicitly reference
the metric(s) by which achievement of the goal will be measured and the time frame according to which the LEA expects to achieve the goal.
Explanation of why the LEA has developed this goal: Explain why the LEA has chosen to prioritize this goal. An explanation must be based
on Dashboard data or other locally collected data. LEAs must describe how the LEA identified this goal for focused attention, including relevant
consultation with educational partners. LEAs are encouraged to promote transparency and understanding around the decision to pursue a focus
goal.
Broad Goal
Goal Description: Describe what the LEA plans to achieve through the actions included in the goal. The description of a broad goal will be
clearly aligned with the expected measurable outcomes included for the goal. The goal description organizes the actions and expected
outcomes in a cohesive and consistent manner. A goal description is specific enough to be measurable in either quantitative or qualitative
terms. A broad goal is not as specific as a focus goal. While it is specific enough to be measurable, there are many different metrics for
measuring progress toward the goal.
Explanation of why the LEA has developed this goal: Explain why the LEA developed this goal and how the actions and metrics grouped
together will help achieve the goal.
Maintenance of Progress Goal
Goal Description: Describe how the LEA intends to maintain the progress made in the LCFF State Priorities not addressed by the other goals
in the LCAP. Use this type of goal to address the state priorities and applicable metrics not addressed within the other goals in the LCAP. The
state priorities and metrics to be addressed in this section are those for which the LEA, in consultation with educational partners, has
determined to maintain actions and monitor progress while focusing implementation efforts on the actions covered by other goals in the LCAP.
Explanation of why the LEA has developed this goal: Explain how the actions will sustain the progress exemplified by the related metrics.

Local Control and Accountability Plan Instructions Page 8 of 23
Required Goals
In general, LEAs have flexibility in determining what goals to include in the LCAP and what those goals will address; however, beginning with
the development of the 2022–23 LCAP, LEAs that meet certain criteria are required to include a specific goal in their LCAP.
Consistently low-performing student group(s) criteria: An LEA is eligible for Differentiated Assistance for three or more consecutive years
based on the performance of the same student group or groups in the Dashboard. A list of the LEAs required to include a goal in the LCAP
based on student group performance, and the student group(s) that lead to identification, may be found on the CDE’s Local Control Funding
Formula web page at https://www.cde.ca.gov/fg/aa/lc/.
• Consistently low-performing student group(s) goal requirement: An LEA meeting the consistently low-performing student group(s)
criteria must include a goal in its LCAP focused on improving the performance of the student group or groups that led to the LEA’s
eligibility for Differentiated Assistance. This goal must include metrics, outcomes, actions, and expenditures specific to addressing the
needs of, and improving outcomes for, this student group or groups. An LEA required to address multiple student groups is not required
to have a goal to address each student group; however, each student group must be specifically addressed in the goal. This requirement
may not be met by combining this required goal with another goal.
• Goal Description: Describe the outcomes the LEA plans to achieve to address the needs of, and improve outcomes for, the student
group or groups that led to the LEA’s eligibility for Differentiated Assistance.
• Explanation of why the LEA has developed this goal: Explain why the LEA is required to develop this goal, including identifying the
student group(s) that lead to the LEA being required to develop this goal, how the actions and associated metrics included in this goal
differ from previous efforts to improve outcomes for the student group(s), and why the LEA believes the actions, metrics, and
expenditures included in this goal will help achieve the outcomes identified in the goal description.
Low-performing school(s) criteria: The following criteria only applies to a school district or COE with two or more schools; it does not apply to
a single-school district. A school district or COE has one or more schools that, for two consecutive years, received the two lowest performance
levels on all but one of the state indicators for which the school(s) receive performance levels in the Dashboard and the performance of the “All
Students” student group for the LEA is at least one performance level higher in all of those indicators. A list of the LEAs required to include a
goal in the LCAP based on school performance, and the school(s) that lead to identification, may be found on the CDE’s Local Control Funding
Formula web page at https://www.cde.ca.gov/fg/aa/lc/.
• Low-performing school(s) goal requirement: A school district or COE meeting the low-performing school(s) criteria must include a
goal in its LCAP focusing on addressing the disparities in performance between the school(s) and the LEA as a whole. This goal must
include metrics, outcomes, actions, and expenditures specific to addressing the needs of, and improving outcomes for, the students
enrolled at the low-performing school or schools. An LEA required to address multiple schools is not required to have a goal to address
each school; however, each school must be specifically addressed in the goal. This requirement may not be met by combining this goal
with another goal.
Local Control and Accountability Plan Instructions Page 9 of 23
• Goal Description: Describe what outcomes the LEA plans to achieve to address the disparities in performance between the students
enrolled at the low-performing school(s) and the students enrolled at the LEA as a whole.
• Explanation of why the LEA has developed this goal: Explain why the LEA is required to develop this goal, including identifying the
schools(s) that lead to the LEA being required to develop this goal; how the actions and associated metrics included in this goal differ
from previous efforts to improve outcomes for the school(s); and why the LEA believes the actions, metrics, and expenditures included in
this goal will help achieve the outcomes for students enrolled at the low-performing school or schools identified in the goal description.
Measuring and Reporting Results:
For each LCAP year, identify the metric(s) that the LEA will use to track progress toward the expected outcomes. LEAs are encouraged to
identify metrics for specific student groups, as appropriate, including expected outcomes that would reflect narrowing of any existing
performance gaps.
Include in the baseline column the most recent data associated with this metric available at the time of adoption of the LCAP for the first year of
the three-year plan. LEAs may use data as reported on the 2019 Dashboard for the baseline of a metric only if that data represents the most
recent available (e.g., high school graduation rate).
Using the most recent data available may involve reviewing data the LEA is preparing for submission to the California Longitudinal Pupil
Achievement Data System (CALPADS) or data that the LEA has recently submitted to CALPADS. Because final 2020–21 outcomes on some
metrics may not be computable at the time the 2021–24 LCAP is adopted (e.g., graduation rate, suspension rate), the most recent data
available may include a point in time calculation taken each year on the same date for comparability purposes.
The baseline data shall remain unchanged throughout the three-year LCAP.
Complete the table as follows:
● Metric: Indicate how progress is being measured using a metric.
● Baseline: Enter the baseline when completing the LCAP for 2021–22. As described above, the baseline is the most recent data
associated with a metric. Indicate the school year to which the data applies, consistent with the instructions above.
● Year 1 Outcome: When completing the LCAP for 2022–23, enter the most recent data available. Indicate the school year to which the
data applies, consistent with the instructions above.
● Year 2 Outcome: When completing the LCAP for 2023–24, enter the most recent data available. Indicate the school year to which the
data applies, consistent with the instructions above.

Local Control and Accountability Plan Instructions Page 10 of 23
● Year 3 Outcome: When completing the LCAP for 2024–25, enter the most recent data available. Indicate the school year to which the
data applies, consistent with the instructions above. The 2024–25 LCAP will be the first year in the next three-year cycle. Completing this
column will be part of the Annual Update for that year.
● Desired Outcome for 2023–24: When completing the first year of the LCAP, enter the desired outcome for the relevant metric the LEA
expects to achieve by the end of the 2023–24 LCAP year.
Timeline for completing the “Measuring and Reporting Results” part of the Goal.
Metric Baseline Year 1 Outcome Year 2 Outcome Year 3 Outcome
Desired Outcome
for Year 3
(2023–24)
Enter information
in this box when
completing the
LCAP for 2021–
22.
Enter information
in this box when
completing the
LCAP for 2021–
22.
Enter information
in this box when
completing the
LCAP for 2022–
23. Leave blank
until then.
Enter information
in this box when
completing the
LCAP for 2023–
24. Leave blank
until then.
Enter information
in this box when
completing the
LCAP for 2024–
25. Leave blank
until then.
Enter information
in this box when
completing the
LCAP for 2021–
22 or when
adding a new
metric.
The metrics may be quantitative or qualitative; but at minimum, an LEA’s LCAP must include goals that are measured using all of the applicable
metrics for the related state priorities, in each LCAP year as applicable to the type of LEA. To the extent a state priority does not specify one or
more metrics (e.g., implementation of state academic content and performance standards), the LEA must identify a metric to use within the
LCAP. For these state priorities, LEAs are encouraged to use metrics based on or reported through the relevant self-reflection tool for local
indicators within the Dashboard.
Actions: Enter the action number. Provide a short title for the action. This title will also appear in the action tables. Provide a description of the
action. Enter the total amount of expenditures associated with this action. Budgeted expenditures from specific fund sources will be provided in
the summary tables. Indicate whether the action contributes to meeting the increase or improved services requirement as described in the
Increased or Improved Services section using a “Y” for Yes or an “N” for No. (Note: for each such action offered on an LEA-wide or schoolwide
basis, the LEA will need to provide additional information in the Increased or Improved Summary Section to address the requirements in
California Code of Regulations, Title 5 [5 CCR] Section 15496(b) in the Increased or Improved Services Section of the LCAP).

Local Control and Accountability Plan Instructions Page 11 of 23
Actions for English Learners: School districts, COEs, and charter schools that have a numerically significant English learner student
subgroup must include specific actions in the LCAP related to, at a minimum, the language acquisition programs, as defined in EC
Section 306, provided to students and professional development activities specific to English learners.
Actions for Foster Youth: School districts, COEs, and charter schools that have a numerically significant Foster Youth student
subgroup are encouraged to include specific actions in the LCAP designed to meet needs specific to Foster Youth students.
Goal Analysis:
Enter the LCAP Year.
Using actual annual measurable outcome data, including data from the Dashboard, analyze whether the planned actions were effective in
achieving the goal. Respond to the prompts as instructed.
● Describe the overall implementation of the actions to achieve the articulated goal. Include a discussion of relevant challenges and
successes experienced with the implementation process. This must include any instance where the LEA did not implement a planned
action or implemented a planned action in a manner that differs substantively from how it was described in the adopted LCAP.
● Explain material differences between Budgeted Expenditures and Estimated Actual Expenditures and between the Planned Percentages
of Improved Services and Estimated Actual Percentages of Improved Services, as applicable. Minor variances in expenditures or
percentages do not need to be addressed, and a dollar-for-dollar accounting is not required.
● Describe the effectiveness of the specific actions to achieve the articulated goal as measured by the LEA. In some cases, not all actions
in a goal will be intended to improve performance on all of the metrics associated with the goal. When responding to this prompt, LEAs
may assess the effectiveness of a single action or group of actions within the goal in the context of performance on a single metric or
group of specific metrics within the goal that are applicable to the action(s). Grouping actions with metrics will allow for more robust
analysis of whether the strategy the LEA is using to impact a specified set of metrics is working and increase transparency for
educational partners. LEAs are encouraged to use such an approach when goals include multiple actions and metrics that are not closely
associated.
● Describe any changes made to this goal, expected outcomes, metrics, or actions to achieve this goal as a result of this analysis and
analysis of the data provided in the Dashboard or other local data, as applicable.
Increased or Improved Services for Foster Youth, English Learners, and Low-
Income Students

Local Control and Accountability Plan Instructions Page 12 of 23
Purpose
A well-written Increased or Improved Services section provides educational partners with a comprehensive description, within a single
dedicated section, of how an LEA plans to increase or improve services for its unduplicated students in grades TK–12 as compared to all
students in grades TK–12, as applicable, and how LEA-wide or schoolwide actions identified for this purpose meet regulatory requirements.
Descriptions provided should include sufficient detail yet be sufficiently succinct to promote a broader understanding of educational partners to
facilitate their ability to provide input. An LEA’s description in this section must align with the actions included in the Goals and Actions section
as contributing.
Requirements and Instructions
Projected LCFF Supplemental and/or Concentration Grants: Specify the amount of LCFF supplemental and concentration grant funds the
LEA estimates it will receive in the coming year based on the number and concentration of low income, foster youth, and English learner
students.
Projected Additional LCFF Concentration Grant (15 percent): Specify the amount of additional LCFF concentration grant add-on funding, as
described in EC Section 42238.02, that the LEA estimates it will receive in the coming year.
Projected Percentage to Increase or Improve Services for the Coming School Year: Specify the estimated percentage by which services
for unduplicated pupils must be increased or improved as compared to the services provided to all students in the LCAP year as calculated
pursuant to 5 CCR Section 15496(a)(7).
LCFF Carryover — Percentage: Specify the LCFF Carryover — Percentage identified in the LCFF Carryover Table. If a carryover percentage
is not identified in the LCFF Carryover Table, specify a percentage of zero (0.00%).
LCFF Carryover — Dollar: Specify the LCFF Carryover — Dollar amount identified in the LCFF Carryover Table. If a carryover amount is not
identified in the LCFF Carryover Table, specify an amount of zero ($0).
Total Percentage to Increase or Improve Services for the Coming School Year: Add the Projected Percentage to Increase or Improve
Services for the Coming School Year and the Proportional LCFF Required Carryover Percentage and specify the percentage. This is the LEAs
percentage by which services for unduplicated pupils must be increased or improved as compared to the services provided to all students in the
LCAP year, as calculated pursuant to 5 CCR Section 15496(a)(7).
Required Descriptions:
For each action being provided to an entire school, or across the entire school district or COE, an explanation of (1) how the needs of
foster youth, English learners, and low-income students were considered first, and (2) how these actions are effective in meeting the
goals for these students.

Local Control and Accountability Plan Instructions Page 13 of 23
For each action included in the Goals and Actions section as contributing to the increased or improved services requirement for unduplicated
pupils and provided on an LEA-wide or schoolwide basis, the LEA must include an explanation consistent with 5 CCR Section 15496(b). For
any such actions continued into the 2021–24 LCAP from the 2017–2020 LCAP, the LEA must determine whether or not the action was effective
as expected, and this determination must reflect evidence of outcome data or actual implementation to date.
Principally Directed and Effective: An LEA demonstrates how an action is principally directed towards and effective in meeting the LEA’s
goals for unduplicated students when the LEA explains how:
● It considers the needs, conditions, or circumstances of its unduplicated pupils;
● The action, or aspect(s) of the action (including, for example, its design, content, methods, or location), is based on these considerations;
and
● The action is intended to help achieve an expected measurable outcome of the associated goal.
As such, the response provided in this section may rely on a needs assessment of unduplicated students.
Conclusory statements that a service will help achieve an expected outcome for the goal, without an explicit connection or further explanation
as to how, are not sufficient. Further, simply stating that an LEA has a high enrollment percentage of a specific student group or groups does
not meet the increase or improve services standard because enrolling students is not the same as serving students.
For example, if an LEA determines that low-income students have a significantly lower attendance rate than the attendance rate for all students,
it might justify LEA-wide or schoolwide actions to address this area of need in the following way:
After assessing the needs, conditions, and circumstances of our low-income students, we learned that the attendance rate of our low-
income students is 7 percent lower than the attendance rate for all students. (Needs, Conditions, Circumstances [Principally Directed])
In order to address this condition of our low-income students, we will develop and implement a new attendance program that is designed
to address some of the major causes of absenteeism, including lack of reliable transportation and food, as well as a school climate that
does not emphasize the importance of attendance. Goal N, Actions X, Y, and Z provide additional transportation and nutritional
resources as well as a districtwide educational campaign on the benefits of high attendance rates. (Contributing Action[s])
These actions are being provided on an LEA-wide basis and we expect/hope that all students with less than a 100 percent attendance
rate will benefit. However, because of the significantly lower attendance rate of low-income students, and because the actions meet
needs most associated with the chronic stresses and experiences of a socio-economically disadvantaged status, we expect that the
attendance rate for our low-income students will increase significantly more than the average attendance rate of all other students.
(Measurable Outcomes [Effective In])

Local Control and Accountability Plan Instructions Page 14 of 23
COEs and Charter Schools: Describe how actions included as contributing to meeting the increased or improved services requirement on an
LEA-wide basis are principally directed to and effective in meeting its goals for unduplicated pupils in the state and any local priorities as
described above. In the case of COEs and charter schools, schoolwide and LEA-wide are considered to be synonymous.
For School Districts Only:
Actions Provided on an LEA-Wide Basis:
Unduplicated Percentage > 55 percent: For school districts with an unduplicated pupil percentage of 55 percent or more, describe how these
actions are principally directed to and effective in meeting its goals for unduplicated pupils in the state and any local priorities as described
above.
Unduplicated Percentage < 55 percent: For school districts with an unduplicated pupil percentage of less than 55 percent, describe how
these actions are principally directed to and effective in meeting its goals for unduplicated pupils in the state and any local priorities. Also
describe how the actions are the most effective use of the funds to meet these goals for its unduplicated pupils. Provide the basis for this
determination, including any alternatives considered, supporting research, experience, or educational theory.
Actions Provided on a Schoolwide Basis:
School Districts must identify in the description those actions being funded and provided on a schoolwide basis, and include the required
description supporting the use of the funds on a schoolwide basis.
For schools with 40 percent or more enrollment of unduplicated pupils: Describe how these actions are principally directed to and
effective in meeting its goals for its unduplicated pupils in the state and any local priorities.
For school districts expending funds on a schoolwide basis at a school with less than 40 percent enrollment of unduplicated pupils:
Describe how these actions are principally directed to and how the actions are the most effective use of the funds to meet its goals for foster
youth, English learners, and low-income students in the state and any local priorities.
A description of how services for foster youth, English learners, and low-income students are being increased or improved by the
percentage required.
Consistent with the requirements of 5 CCR Section 15496, describe how services provided for unduplicated pupils are increased or improved
by at least the percentage calculated as compared to the services provided for all students in the LCAP year. To improve services means to
grow services in quality and to increase services means to grow services in quantity. Services are increased or improved by those actions in the
LCAP that are included in the Goals and Actions section as contributing to the increased or improved services requirement, whether they are
provided on an LEA-wide or schoolwide basis or provided on a limited basis to unduplicated students. A limited action is an action that only
serves foster youth, English learners, and/or low-income students. This description must address how these action(s) are expected to result in

Local Control and Accountability Plan Instructions Page 15 of 23
the required proportional increase or improvement in services for unduplicated pupils as compared to the services the LEA provides to all
students for the relevant LCAP year.
For any action contributing to meeting the increased or improved services requirement that is associated with a Planned Percentage of
Improved Services in the Contributing Summary Table rather than an expenditure of LCFF funds, describe the methodology that was used to
determine the contribution of the action towards the proportional percentage. See the instructions for determining the Planned Percentage of
Improved Services for information on calculating the Percentage of Improved Services.
A description of the plan for how the additional concentration grant add-on funding identified above will be used to increase the
number of staff providing direct services to students at schools that have a high concentration (above 55 percent) of foster youth,
English learners, and low-income students, as applicable.
An LEA that receives the additional concentration grant add-on described in EC Section 42238.02 is required to demonstrate how it is using
these funds to increase the number of staff who provide direct services to students at schools with an enrollment of unduplicated students that
is greater than 55 percent as compared to the number of staff who provide direct services to students at schools with an enrollment of
unduplicated students that is equal to or less than 55 percent. The staff who provide direct services to students must be certificated staff and/or
classified staff employed by the LEA; classified staff includes custodial staff.
Provide the following descriptions, as applicable to the LEA:
An LEA that does not receive a concentration grant or the concentration grant add-on must indicate that a response to this prompt is not
applicable.
Identify the goal and action numbers of the actions in the LCAP that the LEA is implementing to meet the requirement to increase the number of
staff who provide direct services to students at schools with an enrollment of unduplicated students that is greater than 55 percent.
An LEA that does not have comparison schools from which to describe how it is using the concentration grant add-on funds, such as an LEA
that only has schools with an enrollment of unduplicated students that is greater than 55 percent, must describe how it is using the funds to
increase the number of credentialed staff, classified staff, or both, including custodial staff, who provide direct services to students at selected
schools and the criteria used to determine which schools require additional staffing support.
In the event that an additional concentration grant add-on is not sufficient to increase staff providing direct services to students at a school with
an enrollment of unduplicated students that is greater than 55 percent, the LEA must describe how it is using the funds to retain staff providing
direct services to students at a school with an enrollment of unduplicated students that is greater than 55 percent.
Complete the table as follows:
• Provide the staff-to-student ratio of classified staff providing direct services to students with a concentration of unduplicated students that
is 55 percent or less and the staff-to-student ratio of classified staff providing direct services to students at schools with a concentration

Local Control and Accountability Plan Instructions Page 16 of 23
of unduplicated students that is greater than 55 percent, as applicable to the LEA. The LEA may group its schools by grade span
(Elementary, Middle/Junior High, and High Schools), as applicable to the LEA. The staff-to-student ratio must be based on the number of
full time equivalent (FTE) staff and the number of enrolled students as counted on the first Wednesday in October of each year.
• Provide the staff-to-student ratio of certificated staff providing direct services to students at schools with a concentration of unduplicated
students that is 55 percent or less and the staff-to-student ratio of certificated staff providing direct services to students at schools with a
concentration of unduplicated students that is greater than 55 percent, as applicable to the LEA. The LEA may group its schools by
grade span (Elementary, Middle/Junior High, and High Schools), as applicable to the LEA. The staff-to-student ratio must be based on
the number of FTE staff and the number of enrolled students as counted on the first Wednesday in October of each year.
Action Tables
Complete the Data Entry Table for each action in the LCAP. The information entered into this table will automatically populate the other Action
Tables. Information is only entered into the Data Entry Table, the Annual Update Table, the Contributing Actions Annual Update Table, and the
LCFF Carryover Table. With the exception of the Data Entry Table, the word “input” has been added to column headers to aid in identifying the
column(s) where information will be entered. Information is not entered on the remaining Action tables.
The following tables are required to be included as part of the LCAP adopted by the local governing board or governing body:
• Table 1: Total Planned Expenditures Table (for the coming LCAP Year)
• Table 2: Contributing Actions Table (for the coming LCAP Year)
• Table 3: Annual Update Table (for the current LCAP Year)
• Table 4: Contributing Actions Annual Update Table (for the current LCAP Year)
• Table 5: LCFF Carryover Table (for the current LCAP Year)
Note: The coming LCAP Year is the year that is being planned for, while the current LCAP year is the current year of implementation. For
example, when developing the 2022–23 LCAP, 2022–23 will be the coming LCAP Year and 2021–22 will be the current LCAP Year.
Data Entry Table
The Data Entry Table may be included in the LCAP as adopted by the local governing board or governing body, but is not required to be
included. In the Data Entry Table, input the following information for each action in the LCAP for that applicable LCAP year:
• LCAP Year: Identify the applicable LCAP Year.
Local Control and Accountability Plan Instructions Page 17 of 23
• 1. Projected LCFF Base Grant: Provide the total amount of LCFF funding the LEA estimates it will receive for the coming school year,
excluding the supplemental and concentration grants and the add-ons for the Targeted Instructional Improvement Grant Program and the
Home to School Transportation Program, pursuant to 5 CCR Section 15496(a)(8).
See EC sections 2574 (for COEs) and 42238.02 (for school districts and charter schools), as applicable, for LCFF apportionment
calculations.
• 2. Projected LCFF Supplemental and/or Concentration Grants: Provide the total amount of LCFF supplemental and concentration
grants the LEA estimates it will receive on the basis of the number and concentration of unduplicated students for the coming school
year.
• 3. Projected Percentage to Increase or Improve Services for the Coming School Year: This percentage will not be entered; it is
calculated based on the Projected LCFF Base Grant and the Projected LCFF Supplemental and/or Concentration Grants, pursuant to 5
CCR Section 15496(a)(8). This is the percentage by which services for unduplicated pupils must be increased or improved as compared
to the services provided to all students in the coming LCAP year.
• LCFF Carryover — Percentage: Specify the LCFF Carryover — Percentage identified in the LCFF Carryover Table from the prior LCAP
year. If a carryover percentage is not identified in the LCFF Carryover Table, specify a percentage of zero (0.00%).
• Total Percentage to Increase or Improve Services for the Coming School Year: This percentage will not be entered; it is calculated
based on the Projected Percentage to Increase or Improve Services for the Coming School Year and the LCFF Carryover —
Percentage. This is the percentage by which the LEA must increase or improve services for unduplicated pupils as compared to the
services provided to all students in the coming LCAP year.
• Goal #: Enter the LCAP Goal number for the action.
• Action #: Enter the action’s number as indicated in the LCAP Goal.
• Action Title: Provide a title of the action.
• Student Group(s): Indicate the student group or groups who will be the primary beneficiary of the action by entering “All,” or by entering
a specific student group or groups.
• Contributing to Increased or Improved Services?: Type “Yes” if the action is included as contributing to meeting the increased or
improved services; OR, type “No” if the action is not included as contributing to meeting the increased or improved services.
• If “Yes” is entered into the Contributing column, then complete the following columns:
Local Control and Accountability Plan Instructions Page 18 of 23
o Scope: The scope of an action may be LEA-wide (i.e., districtwide, countywide, or charterwide), schoolwide, or limited. An action
that is LEA-wide in scope upgrades the entire educational program of the LEA. An action that is schoolwide in scope upgrades the
entire educational program of a single school. An action that is limited in its scope is an action that serves only one or more
unduplicated student groups.
o Unduplicated Student Group(s): Regardless of scope, contributing actions serve one or more unduplicated student groups.
Indicate one or more unduplicated student groups for whom services are being increased or improved as compared to what all
students receive.
o Location: Identify the location where the action will be provided. If the action is provided to all schools within the LEA, the LEA
must indicate “All Schools.” If the action is provided to specific schools within the LEA or specific grade spans only, the LEA must
enter “Specific Schools” or “Specific Grade Spans.” Identify the individual school or a subset of schools or grade spans (e.g., all
high schools or grades transitional kindergarten through grade five), as appropriate.
• Time Span: Enter “ongoing” if the action will be implemented for an indeterminate period of time. Otherwise, indicate the span of time for
which the action will be implemented. For example, an LEA might enter “1 Year,” or “2 Years,” or “6 Months.”
• Total Personnel: Enter the total amount of personnel expenditures utilized to implement this action.
• Total Non-Personnel: This amount will be automatically calculated based on information provided in the Total Personnel column and
the Total Funds column.
• LCFF Funds: Enter the total amount of LCFF funds utilized to implement this action, if any. LCFF funds include all funds that make up
an LEA’s total LCFF target (i.e., base grant, grade span adjustment, supplemental grant, concentration grant, Targeted Instructional
Improvement Block Grant, and Home-To-School Transportation).
o Note: For an action to contribute towards meeting the increased or improved services requirement it must include some measure
of LCFF funding. The action may also include funding from other sources, however the extent to which an action contributes to
meeting the increased or improved services requirement is based on the LCFF funding being used to implement the action.
• Other State Funds: Enter the total amount of Other State Funds utilized to implement this action, if any.
• Local Funds: Enter the total amount of Local Funds utilized to implement this action, if any.
• Federal Funds: Enter the total amount of Federal Funds utilized to implement this action, if any.
• Total Funds: This amount is automatically calculated based on amounts entered in the previous four columns.
Local Control and Accountability Plan Instructions Page 19 of 23
• Planned Percentage of Improved Services: For any action identified as contributing, being provided on a Limited basis to unduplicated
students, and that does not have funding associated with the action, enter the planned quality improvement anticipated for the action as
a percentage rounded to the nearest hundredth (0.00%). A limited action is an action that only serves foster youth, English learners,
and/or low-income students.
o As noted in the instructions for the Increased or Improved Services section, when identifying a Planned Percentage of Improved
Services, the LEA must describe the methodology that it used to determine the contribution of the action towards the proportional
percentage. The percentage of improved services for an action corresponds to the amount of LCFF funding that the LEA
estimates it would expend to implement the action if it were funded.
For example, an LEA determines that there is a need to analyze data to ensure that instructional aides and expanded learning
providers know what targeted supports to provide to students who are foster youth. The LEA could implement this action by hiring
additional staff to collect and analyze data and to coordinate supports for students, which the LEA estimates would cost $165,000.
Instead, the LEA chooses to utilize a portion of existing staff time to analyze data relating to students who are foster youth. This
analysis will then be shared with site principals who will use the data to coordinate services provided by instructional assistants
and expanded learning providers to target support to students. In this example, the LEA would divide the estimated cost of
$165,000 by the amount of LCFF Funding identified in the Data Entry Table and then convert the quotient to a percentage. This
percentage is the Planned Percentage of Improved Service for the action.
Contributing Actions Table
As noted above, information will not be entered in the Contributing Actions Table; however, the ‘Contributing to Increased or Improved
Services?’ column will need to be checked to ensure that only actions with a “Yes” are displaying. If actions with a “No” are displayed or if
actions that are contributing are not displaying in the column, use the drop-down menu in the column header to filter only the “Yes” responses.
Annual Update Table
In the Annual Update Table, provide the following information for each action in the LCAP for the relevant LCAP year:
• Estimated Actual Expenditures: Enter the total estimated actual expenditures to implement this action, if any.
Contributing Actions Annual Update Table
In the Contributing Actions Annual Update Table, check the ‘Contributing to Increased or Improved Services?’ column to ensure that only
actions with a “Yes” are displaying. If actions with a “No” are displayed or if actions that are contributing are not displaying in the column, use
the drop-down menu in the column header to filter only the “Yes” responses. Provide the following information for each contributing action in the
LCAP for the relevant LCAP year:
Local Control and Accountability Plan Instructions Page 20 of 23
• 6. Estimated Actual LCFF Supplemental and/or Concentration Grants: Provide the total amount of LCFF supplemental and
concentration grants the LEA estimates it will actually receive based on of the number and concentration of unduplicated students in the
current school year.
• Estimated Actual Expenditures for Contributing Actions: Enter the total estimated actual expenditure of LCFF funds used to
implement this action, if any.
• Estimated Actual Percentage of Improved Services: For any action identified as contributing, being provided on a Limited basis only
to unduplicated students, and that does not have funding associated with the action, enter the total estimated actual quality improvement
anticipated for the action as a percentage rounded to the nearest hundredth (0.00%).
o Building on the example provided above for calculating the Planned Percentage of Improved Services, the LEA in the example
implements the action. As part of the annual update process, the LEA reviews implementation and student outcome data and
determines that the action was implemented with fidelity and that outcomes for foster youth students improved. The LEA reviews
the original estimated cost for the action and determines that had it hired additional staff to collect and analyze data and to
coordinate supports for students that estimated actual cost would have been $169,500 due to a cost of living adjustment. The LEA
would divide the estimated actual cost of $169,500 by the amount of LCFF Funding identified in the Data Entry Table and then
convert the quotient to a percentage. This percentage is the Estimated Actual Percentage of Improved Services for the action.
LCFF Carryover Table
• 9. Estimated Actual LCFF Base Grant: Provide the total amount of LCFF funding the LEA estimates it will receive for the current school
year, excluding the supplemental and concentration grants and the add-ons for the Targeted Instructional Improvement Grant Program
and the Home to School Transportation Program, pursuant to 5 CCR Section 15496(a)(8).
• 10. Total Percentage to Increase or Improve Services for the Current School Year: This percentage will not be entered. The
percentage is calculated based on the amounts of the Estimated Actual LCFF Base Grant (9) and the Estimated Actual LCFF
Supplemental and/or Concentration Grants (6), pursuant to 5 CCR Section 15496(a)(8), plus the LCFF Carryover – Percentage from the
prior year. This is the percentage by which services for unduplicated pupils must be increased or improved as compared to the services
provided to all students in the current LCAP year.
Calculations in the Action Tables
To reduce the duplication of effort of LEAs, the Action Tables include functionality such as pre-population of fields and cells based on the
information provided in the Data Entry Table, the Annual Update Summary Table, and the Contributing Actions Table. For transparency, the
functionality and calculations used are provided below.
Local Control and Accountability Plan Instructions Page 21 of 23
Contributing Actions Table
• 4. Total Planned Contributing Expenditures (LCFF Funds)
o This amount is the total of the Planned Expenditures for Contributing Actions (LCFF Funds) column
• 5. Total Planned Percentage of Improved Services
o This percentage is the total of the Planned Percentage of Improved Services column
• Planned Percentage to Increase or Improve Services for the coming school year (4 divided by 1, plus 5)
o This percentage is calculated by dividing the Total Planned Contributing Expenditures (4) by the Projected LCFF Base Grant (1),
converting the quotient to a percentage, and adding it to the Total Planned Percentage of Improved Services (5).
Contributing Actions Annual Update Table
Pursuant to EC Section 42238.07(c)(2), if the Total Planned Contributing Expenditures (4) is less than the Estimated Actual LCFF Supplemental
and Concentration Grants (6), the LEA is required to calculate the difference between the Total Planned Percentage of Improved Services (5)
and the Total Estimated Actual Percentage of Improved Services (7). If the Total Planned Contributing Expenditures (4) is equal to or greater
than the Estimated Actual LCFF Supplemental and Concentration Grants (6), the Difference Between Planned and Estimated Actual
Percentage of Improved Services will display “Not Required.”
• 6. Estimated Actual LCFF Supplemental and Concentration Grants
o This is the total amount of LCFF supplemental and concentration grants the LEA estimates it will actually receive based on of the
number and concentration of unduplicated students in the current school year.
• 4. Total Planned Contributing Expenditures (LCFF Funds)
o This amount is the total of the Last Year's Planned Expenditures for Contributing Actions (LCFF Funds)
• 7. Total Estimated Actual Expenditures for Contributing Actions
o This amount is the total of the Estimated Actual Expenditures for Contributing Actions (LCFF Funds)
• Difference Between Planned and Estimated Actual Expenditures for Contributing Actions (Subtract 7 from 4)
o This amount is the Total Estimated Actual Expenditures for Contributing Actions (7) subtracted from the Total Planned
Contributing Expenditures (4)
Local Control and Accountability Plan Instructions Page 22 of 23
• 5. Total Planned Percentage of Improved Services (%)
o This amount is the total of the Planned Percentage of Improved Services column
• 8. Total Estimated Actual Percentage of Improved Services (%)
o This amount is the total of the Estimated Actual Percentage of Improved Services column
• Difference Between Planned and Estimated Actual Percentage of Improved Services (Subtract 5 from 8)
o This amount is the Total Planned Percentage of Improved Services (5) subtracted from the Total Estimated Actual Percentage of
Improved Services (8)
LCFF Carryover Table
• 10. Total Percentage to Increase or Improve Services for the Current School Year (6 divided by 9 + Carryover %)
o This percentage is the Estimated Actual LCFF Supplemental and/or Concentration Grants (6) divided by the Estimated Actual
LCFF Base Grant (9) plus the LCFF Carryover – Percentage from the prior year.
• 11. Estimated Actual Percentage of Increased or Improved Services (7 divided by 9, plus 8)
o This percentage is the Total Estimated Actual Expenditures for Contributing Actions (7) divided by the LCFF Funding (9), then
converting the quotient to a percentage and adding the Total Estimated Actual Percentage of Improved Services (8).
• 12. LCFF Carryover — Dollar Amount LCFF Carryover (Subtract 11 from 10 and multiply by 9)
o If the Estimated Actual Percentage of Increased or Improved Services (11) is less than the Estimated Actual Percentage to
Increase or Improve Services (10), the LEA is required to carry over LCFF funds.
The amount of LCFF funds is calculated by subtracting the Estimated Actual Percentage to Increase or Improve Services (11)
from the Estimated Actual Percentage of Increased or Improved Services (10) and then multiplying by the Estimated Actual LCFF
Base Grant (9). This amount is the amount of LCFF funds that is required to be carried over to the coming year.
• 13. LCFF Carryover — Percentage (12 divided by 9)
o This percentage is the unmet portion of the Percentage to Increase or Improve Services that the LEA must carry over into the
coming LCAP year. The percentage is calculated by dividing the LCFF Carryover (12) by the LCFF Funding (9).
California Department of Education
Local Control and Accountability Plan Instructions Page 23 of 23
January 2022
