
Research Summary
c c s r
CONSORTIUM ON
CHICAGO SCHOOL RESEARCH
AT THE UNIVERSITY OF CHICAGO
URBAN EDUCATION INSTITUTE
September 2011
Trends in Chicago’s Schools across Three
Eras of Reform: Summary of Key Findings
Stuart Luppescu, Elaine M. Allensworth, Paul Moore, Marisa de la Torre, James Murphy
with Sanja Jagesic
1
2
3

This report was the result of a group effort by many people, and we greatly appreciate
the support and feedback we received from our colleagues at the Consortium on Chicago
School Research (CCSR) and the CCSR Steering Committee. Special thanks to Holly
Hart for researching and constructing the Reform Timeline and working on the early
stages of this study. Several CCSR directors provided feedback on early drafts of this
report, including Penny Sebring, Paul Goren, David Stevens, Jenny Nagaoka, Melissa
Roderick, and Sue Sporte. We appreciate their efforts greatly. We are also very grateful
for the considerable help of CCSR Associate Director for Communications, Emily Krone,
who provided tireless editing and substantive feedback. We are also very grateful for the
support of our Steering Committee and the members who took the time to read drafts
of this report and provide us with valuable feedback. We particularly thank Kim Zalent,
Arie van der Ploeg, Kathleen St. Louis, Steve Zemelman, Matt Stagner, Josie Yanguas,
and Greg Michie.
We would like to thank the Illinois State Board of Education for providing test data and
Chicago Public Schools (CPS) for their continued cooperation and support in providing us
with data that allow us to do this work.
Most importantly, we want to acknowledge the Chicago Community Trust for taking
the initiative to commission this study and providing the funding to carry it out.
Acknowledgements

2
Chapter
1
consortium on chicago school research at the university of chicago
Table of Contents
Executive Summary ............................................................................. 1
Summary of Key Findings ...................................................................5
Problems with Publicly Reported Statistics ..................................................6
Reading and Math Test Scores in Grades Three through Eight ......................8
High School Test Scores ...........................................................................12
Graduation and Dropout Rates ...............................................................14
Conclusion ................................................................................................17
Endnotes ...................................................................................................21
This is a summary of key findings from a more comprehensive study. The full report is
available at ccsr.uchicago.edu.


2
consortium on chicago school research at the university of chicago
1
Executive Summary
I
n 1988, U.S. Secretary of Education William Bennett proclaimed Chicago’s
public schools to be the worst in the nation. Since that time, Chicago has
been at the forefront of urban school reform. Beginning with a dramatic
move in 1990 to shift power away from the central office, through CEO
Paul Vallas’s use of standardized testing to hold schools and students
accountable for teaching and learning, and into CEO Arne Duncan’s bold
plan to create 100 new schools in 10 years, Chicago has attempted to boost
academic achievement through a succession of innovative policies. Each
wave of reform has brought new practices, programs, and policies that have
interacted with the initiatives of the preceding wave. And with each succes-
sive wave of reform this fundamental question has been raised: Has progress
been made at Chicago Public Schools (CPS)?
This study addresses the question by analyzing trends in elementary
and high school test scores and graduation rates over the past 20 years. Key
findings described briefly in this summary report include:
• Graduation rates have improved dramatically, and high school test scores have
risen; more students are graduating without a decline in average academic
performance.
• Math scores have improved incrementally in the elementary/middle grades,
while elementary/middle grade reading scores have remained fairly flat for
two decades.
• Racial gaps in achievement have steadily increased, with White students
making more progress than Latino students, and African American students
falling behind all other groups.
• Despite progress, the vast majority of CPS students are at academic achieve-
ment levels that are far below what they need to graduate ready for college.

2 Trends in Chicago’s Schools across Three Eras of Reform
Many of the findings in this report contradict trends
that appear in publicly reported data. For instance,
publicly reported statistics indicate that CPS has made
tremendous progress in elementary math and reading
tests, while this analysis demonstrates only incremental
gains in math and almost no growth in reading. The
discrepancies are due to myriad issues with publicly
reported data—including changes in test content and
scoring—that make year-over-year comparisons nearly
impossible without complex statistical analyses, such as
those undertaken for this report. This leads to another
key message in this report:
•
The publicly reported statistics used to hold schools
and districts accountable for making academic
progress are not accurate measures of progress.
For this study, we addressed the problems in the
public statistics by carefully constructing measures
and methods to make valid year-over-year compari-
sons. This allowed us to create an accurate account of
the progress made by CPS since the early 1990s. The
Consortium on Chicago School Research (CCSR) at
the University of Chicago has a long history of tracking
trends in Chicago’s schools. Through 20 years of study-
ing the district, we have developed methods for using
student data to create indicators that are comparable
over time, adjusting for changes in tests, policies, and
conditions that make the publicly reported statistics
unsuitable for gauging trends in student performance.
We divide the last 20 years into three eras of reform,
defined by district leadership and the central reform
policies that those leaders pursued. Era 1 is the time of
decentralized control of schools, when decisions over
budget and staffing were transferred from the central
office to locally elected school boards. Era 2 is defined
by the beginning of mayoral control over the schools,
the tenure of Paul Vallas as CEO, and the beginning
of strong accountability measures for students and
schools. Era 3 is defined by Arne Duncan’s tenure as
CEO, the emphasis on diversification through the
creation of new schools, and a greater use of data in
practice. While these three eras are defined by very
different key policies, each era of reform builds on the
reforms of the previous era.
This report shows areas of substantial progress, as well
as areas of concern, and counters a number of miscon-
ceptions that exist about the state of the schools. What it
does not do is draw conclusions about the effects of par-
ticular school policies on the progress of students. Changes
in student achievement over the last 20 years are a result
of the totality of policies, programs, and demographic
changes that have occurred in and around the schools.
The policies of each new school administration have in-
teracted with the policies of the preceding administration.
In some cases over the past 20 years, individual policies
have been studied; where evidence exists that a policy had a
specific effect on student outcomes, we report it. However,
it is beyond the scope of this study to definitively analyze
the combined effects of myriad policies.
Graduation Rates Have Improved Dramatically,
Without a Decline in High School Performance
Chicago schools have shown remarkable progress over
the last 20 years in high school graduation rates. In the
early 1990s, students who entered Chicago high schools
were equally likely to drop out as to graduate. Now they
are more than twice as likely to graduate as to drop
out. Graduation rates have improved among students
of all racial/ethnic groups and among both boys and
girls. Improvements in graduation rates began to occur
in Era 1, slowed down in Era 2, and then accelerated
considerably in Era 3.
At the same time, high school students have improved
their performance on the tests administered to all high
school juniors in Illinois, with ACT scores rising by
about a point over the last decade. All students who
graduate now do so with courses required for admission
to college, while many students used to take just one
science credit and remedial math and English courses.
Math Scores Have Improved Incrementally in the
Elementary/Middle Grades, but Reading Scores
Have Remained Fairly Flat
Math scores have risen in the elementary/middle
grades; students are now scoring at a level similar to
students who were one year older in the early 1990s,
at least in some grade levels. This could be viewed as a
remarkable improvement; at the same time, the typical
student has moved from just meeting state standards

Executive Summary
3
to a level that is still at the low end of the range of
scores that meet state standards. Students at this level
are extremely unlikely to reach ACT college-readiness
benchmarks by the time they are juniors in high school.
Due to a disconnect between the elementary school
ISAT standards and the high school college-readiness
standards as defined by ACT, elementary students
must actually exceed standards—rather than simply
meet standards—on the Illinois test in order to have a
reasonable chance of meeting ACT college benchmarks
in high school.
Reading scores in the elementary/middle grades
have not shown much improvement over the three
eras of school reform. There were some improvements
in the lower grades during Era 2, and scores improved
modestly among White and Asian students across all
three eras. However, scores have not improved at all
among African American students, which is the largest
racial group in CPS. Reading skills in general remain
at a low level.
While students’ test performance is low in Chicago,
it is not lower than the test performance at other schools
in Illinois that serve similar populations of students.
In fact, Chicago students score better than residents
of other parts of Illinois who attend schools that serve
students with similar backgrounds. However, because
Chicago schools serve a very economically disadvan-
taged student population compared to most of the rest
of Illinois, their performance is much lower than the
average school in Illinois.
The Average Student Is Far Below College-Ready
Standards
Most CPS students meet state learning standards on
the state tests in the elementary/middle grades. How-
ever, the eighth grade state standards are well below
the ninth grade benchmarks for college readiness. Few
CPS students meet these benchmarks when they enter
high school, which means they have little chance of
making enough progress to attain ACT scores that are
expected for admission to four-year colleges. Previous
CCSR research has shown that the elementary state
standards are far easier to meet than the high school
standards, making it appear that students are better
prepared for high school than they actually are.
Racial Gaps Increased in All Eras, Especially the Gap
Between African American Students and Students of
Other Races/Ethnicities
College readiness among African American and Latino
students is an area of particular concern. By 2009, White
and Asian CPS students had average ACT scores that
were close to ACT college-readiness benchmarks. They
were also likely to have taken the high school courses
that would be expected of applicants to selective four-year
colleges. However, the elementary and high school test
scores of African American and Latino students were
much further behind. Furthermore, African American
students’ scores improved the least over the three eras.
Especially in the elementary/middle schools, test scores
for African American students improved at a much
slower rate than those of other students. Average scores
for African American students improved slightly in
math, while improving moderately among other stu-
dents. There were virtually no improvements in reading
scores among African American students, while White
and Asian students showed some modest improvements
and Latino students showed some slight improvements.
Thus, African American students increasingly fell behind
other students over the last 20 years, especially in Era 3.
Even in an Age of Accountability, Publicly Reported
Statistics Are Not Useful for Gauging District Progress
Chicago not only has been at the forefront of school
reform policies but has also been ahead of most of the
rest of the country in collecting data and tracking stu-
dent and school performance. Yet, even with a heavy
emphasis on data use and accountability indicators, the
publicly reported statistics that are used by CPS and
other school districts to gauge progress are simply not
useful for measuring trends over time. The indicators
have changed frequently—due to policies at the local,
state, and federal levels; changes made by test makers;
and changes in the types and numbers of students in-
cluded in the statistics. As there is a greater push at both
the state and federal levels to use data to judge student
and school progress, we must ensure that the statistics
that are used are comparable over time. Otherwise,
future decisions about school reform will be based on
flawed statistics and a poor understanding of where
progress has been made.

4 Trends in Chicago’s Schools across Three Eras of Reform

2
consortium on chicago school research at the university of chicago
5
Summary of Key Findings
C
hicago school reform from 1990 to 2009 can be divided into three eras,
based on district leadership and key policies. Most of the reforms from
one era continued into subsequent eras, making it difficult to attribute the
effects of any policy to a particular CPS administration. Era 1 begins with
the passage of the Chicago School Reform Act of 1988. This act established
Local School Councils, which were composed of the school principal, repre-
sentatives of the faculty, parents, and community members. This act devolved
authority to the local schools that had previously been held by the central
office. The Local School Councils had the power to hire the principal, as well
as to allocate financial resources and to make decisions about curriculum and
other academic matters. We refer to this era as “Decentralization.”
In 1995, the state gave the mayor of Chicago authority over the city
schools. Mayor Richard M. Daley installed his former budget director, Paul
Vallas, in a newly created position: CEO. The Vallas administration brought
stability in district leadership and union negotiations, as well as infrastructure
improvement to the city’s schools. The new administration also enacted tough
policies that were designed to improve student achievement. New graduation
requirements required all students to take a college preparatory curriculum.
Performance standards were enacted for both students and schools based
on standardized test scores, with severe consequences for not meeting the
expectations. Beginning in 1996, students in eighth grade were required to
earn a minimum score on the Iowa Tests of Basic Skills (ITBS) to enroll in
high school. In the next year, students in grades three and six had similar
promotional requirements. This resulted in 7,000 to 10,000 students retained
in grade per year. In addition, schools with large proportions of low-scoring
students were put on probation, subjected to intervention, and, in extreme
cases, reconstituted. Because of the emphasis on testing and test performance,
In this document, we
highlight findings from
a larger report that is
available at ccsr.uchicago.
edu. Here we provide a
quick overview of some key
trends across the system,
which are discussed in
more detail in the larger
report. The larger report
includes additional ways of
looking at trends in student
performance, as well as
information on statistical
methodology. It also
provides information
on some key aspects
of school climate and
organization that are not
included here, particularly
changes in the quality of
school safety, instruction,
professional capacity, and
leadership over time.

6 Trends in Chicago’s Schools across Three Eras of Reform
we refer to this era as “Accountability.” When Paul
Vallas resigned in 2001 he was replaced by his deputy
chief-of-staff, Arne Duncan.
The Duncan administration was characterized
by opening many new charter and contract schools,
focusing on transforming high schools, closing poorly
performing schools, instituting new instructional
programs, and working to improve professional
development. One of the hallmark policies of the
Duncan administration was Renaissance 2010, the
plan to open 100 new schools in 10 years. From 2001
to 2009, Chicago saw 155 new schools open and 82
schools close.
The Duncan administration initiated major efforts
to improve the use of data at schools, developing
mechanisms to provide high schools with timely data
reports on students’ progress in ninth grade and college
outcomes. The Duncan administration pursued various
strategies to increase coherency in curriculum, intensify
professional development efforts, and raise awareness
about the importance of literacy and math through
various initiatives. The era was marked by the creation
and reorganization of central offices around curricular
areas and the provision of math and literacy coaches
to support their efforts.
During the Duncan administration, the federal
government initiated school-level accountability at
the national level through the No Child Left Behind
Act. Because this period featured so many different
approaches to educational reform, including a large
expansion of the number and types of schools in the
system, we call the period of the Duncan administra-
tion “Diversification.” In 2009, Arne Duncan left CPS
to become the U.S. Secretary of Education.
Problems with Publicly Reported Statistics
There is an abundance of student- and school-level
data designed to provide the public with an account of
what is taking place in CPS and in other school
districts across the nation. While these data are useful
for answering some questions, the publicly reported
statistics are not always appropriate for measuring
trends over time. This is a critical issue to address
because there are increasing calls to use data to make
decisions about schools and because substantial
resources are being used to develop new data systems.
The data presented in this report have been adjusted
to address these issues, so that comparisons over
time can be made fairly. To learn more about how
we accounted for issues with the comparability of the
statistics, see Chapter 2 in the full report.
The following is a sampling of the problems that had
to be resolved in order to compare indicators over time:
•
Changes in tests, standards, scoring methods, and
test administration make publicly reported test
scores non-comparable. A number of changes in
tests and testing procedures have occurred since
1990 (see Figure 1), making it difficult to know
if changes in test scores are due to changes in real
learning or a result of changes in the tests.
•
CPS reports the percentage of students who scored
at a certain benchmark in a given year; for example,
the percentage of students who met state standards
in reading or math. Benchmark scores are imprecise
metrics that are not useful for measuring change
over time. This is because change in the statistic
depends more on how many students have scores
that are close to the cut-off point than on how much
growth in learning actually occurs. If many students
have scores close to the cut-off, even small changes
in test scores can show large swings in the percent-
age of students meeting the benchmarks. Similarly,
if few students are close to the cut-off point, large
changes in test scores may barely affect the percent-
age of students meeting the benchmarks. The use
of benchmark scores, rather than average scores,
has led to incorrect assessments of the progress made
in CPS over the last 15 years.
•
The introduction of grade promotion standards in
1996 affected the movement of students through the
elementary/middle grades. Therefore, the composi-
tion of students in particular grades changed dra-
matically. The policy caused many more low-scoring
students to spend extra time in grades three, six, and
eight, while reducing the number of low-scoring
students in grades four and seven in some years.
It also led to the lowest-scoring students spending

Summary of Key Findings
7
2
more time in elementary/middle school so they
were counted in CPS statistics on test performance
for extra years. For example, the lowest-scoring third-
graders in 1997 would be counted in third grade
averages in both 1997 and 1998 because they did not
move on to fourth grade. They would also be included
in CPS statistics for seven years instead of six years,
which would lower district performance levels.
• Not all students’ test scores are counted in district
averages in each year. Because of changes in local
and federal policies, there were declines and then
increases in the proportion of CPS students with
reported test scores (see Figure 2). Prior to 2008,
students’ test scores could be excluded from public
reporting depending on their bilingual or special
education status. Students who transfer schools
mid-year also may not be included in the reported
statistics. At the lowest point, only 74 percent of
students had their scores reported in school or
district averages. Variations in test score reporting
rates affect the test score trends because students
excluded from reporting tend to have lower scores,
on average, than other students.
• The population of students served by CPS changed
over time, gradually becoming more Latino (see
Figure 3). Changes in the types of students attending
CPS could affect test score trends, even if Chicago
schools do no better or worse at educating students,
because historically there are differences in student
achievement by race/ethnicity.
More information about the issues encountered in publicly
reported statistics and the methods we used for addressing
these problems are available in the full report. The full report
also provides further information about inconsistencies in
ISAT scoring.
Figure 1. Numerous changes in the tests make the statistics available to the public non-comparable over time and not useful
for gauging academic progress
Percent of Students at / above Norms (ITBS)
80
60
70
90
50
Publicly Reported Reading Test Scores for Grades Three through Eight
199219911990 1993 1994 1995 1996 1997 1998 1999 2000 2001 2002 2003 2004 2005 2006 2007 2008 2009
ITBS (Percent of Students at / above Norms) ISAT(Percent of Students Meeting / Exceeding State Standards)
40
100
20
10
0
30
80
60
70
90
50
40
100
20
10
0
30
Percent of Students Meeting / Exceeding State Standards (ISAT)
22.3
43.7
59.1
64.9
Change in Scoring
(retroactive)
Change in
Test Content
Change in Standards and
Test Administration
Procedures
Change in Test:
Content, Timing,
Scoring Inconsistent
FIG URE 1
Changes in the tests make the statistics available to the public non-comparable over time
and not useful for gauging academic progress

8 Trends in Chicago’s Schools across Three Eras of Reform
Reading and Math Test Scores in
Grades Three through Eight
Across the three eras, elementary/middle school math
scores in CPS increased on the standardized tests
taken by all third- through eighth-graders in Illinois,
while reading scores inched up slightly. However,
Figure 2. Prior to the Federal No Child Left Behind Act, Many Students’ Test Scores Were Not Included in Publicly Reported Statistics
ITBS
Percent of Students Reported
80
60
70
100
90
50
30
10
20
40
0
Percentage of Students with Test Scores Included in Publicly Reported Statistics
1992 1993 1994 1995 1996 1997 1998 1999 2000 2001 2002 2003 2004 2005 2006 2007 2008 2009
85%
ISAT
84%
81%
80%
80%
78% 78%
74%
75% 74%
74%
75%
76% 76%
83% 83%
93%
94%
Era 1 Era 2 Era 3
FIG URE 2
Prior to the federal No Child Left Behind Act, many students’ test scores were not included in
publicly reported statistics, making statistics reported to the public non-comparable over time
Figure 3. The percentage of Latino students in the district has increased across the three eras, while the percentage of
African American students decreased
Percent of Students Reported
80
60
70
100
90
50
30
10
20
40
0
Racial/Ethnic Composition of CPS Students in Grades Three through Eight
1992 1993 1994 1995 1996 1997 1998 1999 2000 2001 2002 2003 2004 2005 2006 2007 2008 2009
57%
28%
12%
56%
29%
12%
55%
30%
12%
Era 1 Era 2 Era 3
54%
31%
12%
53%
32%
12%
53%
32%
12%
53%
32%
11%
53%
33%
11%
52%
34%
11%
52%
34%
10%
52%
35%
52%
36%
9%10%
51%
37%
9%
50%
38%
9%
49%
39%
9%
48%
47%
41%
9%
40%
9%
46%
42%
9%
African American Latino White Asian
FIG URE 3
The percentage of Latino students has increased across the three eras,
while the percentage of African American students decreased
despite real improvements in math scores and slight
improvements in reading scores, the vast majority of
CPS students remain so far behind when they enter
high school that it is nearly impossible for them to
meet standards on the Prairie State Achievement Exam
(PSAE), the statewide test for juniors that includes

Summary of Key Findings
9
the ACT. These findings, which use statistics that
can be compared fairly over time, show trends that are
very different from the trends in the publicly reported
statistics (such as those shown in Figure 1, on page 7).
In addition, while elementary/middle math and
reading scores improved on average, some groups of stu-
dents improved much less than others. In every era, the
performance gap between African American students
and students of other races/ethnicities widened.
READING test scores rose during Era 2 in the lower
grades, but they were flat during the other eras (see
Figure 4). While it looks as if reading scores rose at the
end of Era 3, our analysis of the 2008 and 2009 tests
suggest that this trend resulted from inconsistencies in
the way that the statewide test for elementary school
students was scored during those years rather than
actual improvements in reading skills among CPS stu-
dents. Indeed, the statewide average and the Chicago
average improved at the same rate in 2008 and 2009,
providing further evidence that the improvement was
likely a result of scoring issues with the statewide test.
Reading scores in Chicago were also flat on the national
exam, the National Assessment of Educational Progress
(NAEP), during the period that students in Chicago
took the ISAT.
MATH scores rose in the middle of Era 1, but they fell
at the end of the era (see Figure 5). In Era 2 they rose
so much that students at some ages had the same aver-
age scores as students one year older at the beginning
of Era 1. Math scores were flat at the beginning of
Era 3, but they showed improvements at the end of the era.
In contrast to reading scores, math scores in Chicago
improved slightly more than math scores statewide at
the end of Era 3, suggesting that part of these gains re-
sulted from real skill improvements among CPS students.
The gains in Era 2, coupled with modest improve-
ment in Era 3, might seem to constitute major progress.
However, as shown in Figure 6, the end result is that the
average student moved from just below meeting state
standards to a level that is still in the bottom half of the
Reading Scores (ISAT Units)
260
240
250
270
230
210
200
190
Era 1 Era 2 Era 3
220
Average Reading Test Scores for Nine to 14-Year-Olds across the Three Eras
Figure 4. Reading scores increased during Era 2, but not in other eras
199219911990 1993 1994 1995 1996 1997 1998 1999 2000 2001 2002 2003 2004 2005 2006 2007 2008 2009
Age 9 Age 10 Age 11 Age 12 Age 13 Age 14
ITBS ISAT
Note: Data from 1990 to 2005 are ITBS rescaled to the ISAT scale. Data records are not
sufficiently accurate at the older ages in the first two years of the study to include in the
figure. The trend lines are broken between 2005 and 2006 to indicate the change in tests that
were given to students. Students took the ITBS prior to 2006 and the ISAT beginning in
2006. Scores are adjusted for changes in race, gender, and socio-economic level; and for
changes in test type, form, and level.
FIG URE 4
Reading scores increased during Era 2, but not in other eras

10 Trends in Chicago’s Schools across Three Eras of Reform
Figure 5. Math scores were up in all eras, especially in Era 2
Math Scores (ISAT Units)
260
240
250
270
230
210
200
190
Average Math Test Scores for Nine through 14-Year-Olds across the Three Eras
199219911990 1993 1994 1995 1996 1997 1998 1999 2000 2001 2002 2003 2004 2005 2006 2007 2008 2009
Note: Data from 1990 to 2005 are ITBS rescaled to the ISAT scale. Data records are not
sufficiently accurate at the older ages in the first two years of the study to include in the
figure. The trend lines are broken between 2005 and 2006 to indicate the change in tests that
were given to students. Students took the ITBS prior to 2006 and the ISAT beginning in
2006. Scores are adjusted for changes in race, gender, and socio-economic level; and for
changes in test type, form, and level.
Era 1 Era 2 Era 3
Age 9 Age 10 Age 11 Age 12 Age 13 Age 14
220
ITBS ISAT
FIG URE 5
Math scores were up in all eras, especially in Era 2
Math Test Scores for 14-Year-Olds
Figure 6. Test scores improved all along the range of scores, not just at the top or bottom
90%
75%
50%
25%
10%
Exceeds
288–
Meets
246–287
Below
221–245
Note: This figure shows the overall distribution of math scores for students in one age group:
14-year-olds. ITBS national percentile ranks and ISAT performance levels are indicated on
the vertical axis. The dashed white lines indicate the ITBS national percentile ranks; the ISAT
performance levels are shown by the background shading. The boxes show the distribution
of math scores by 14-year-olds. The horizontal bar in the middle of the box indicates the
median (50th percentile point); the top and bottom of each box are the 75th percentile and
25th percentile, respectively. The top and bottom of the “whiskers” extending from each box
indicate the 90th and 10th percentile, respectively. Note that the percentiles given by the
boxes pertain to 14-year-olds in CPS, not to national percentiles.
1992 1993 1994 1995 1996 1997 1998 1999 2000 2001 2002 2003
2004
2005 2006 2007 2008 2009
ITBS (National Percentile)
ISAT
ITBS ISAT
FIG URE 6
Math test scores improved all along the range of scores, not just at the top or bottom
Summary of Key Findings
11
Figure 7. Reading test scores were mostly flat and did not improve among African American students
Reading Scores (ISAT Units)
250
230
240
270
260
220
200
Reading Test Scores in Elementary/Middle Grades by Racial/Ethnic Group
199219911990 1993 1994 1995 1996 1997 1998 1999 2000 2001 2002 2003 2004 2005 2006 2007 2008 2009
Era 1 Era 2 Era 3
210
African American Latino White Asian
ITBS ISAT
Note: The decline in scores in 2006 is a result of the change in tests and the lack of familiarity
with the new test format, as described in the full report. Trends from 2006 through 2009 could
not be adjusted for changes in ISAT scoring and do not seem to reflect real changes in skills. See
the full report for more details.
FIG URE 7
Reading test scores did not improve among African American students; they improved slightly for other groups
“meets standards” category. This is a problem because
the state sets a very low bar for meeting standards in
elementary/middle school. In fact, eighth grade stu-
dents at the very top of the “meets” category have only
about a 60 percent chance of getting a 20 or above on
the ACT three years subsequent.
1
Meanwhile, only
about one-quarter to one-third of students in the low/
middle region of the “meets” category reach the 20
point mark on the ACT three years later. Thus, the
typical CPS eighth-grader will need to show extraor-
dinary learning gains in high school to have test scores
expected for college by the time he or she graduates.
• Reading and math scores grew more for Asian, White,
and Latino students than for African American students.
• Reading scores improved slightly among all
racial/ethnic groups, except African American
students (see Figure 7). The average reading
score for African Americans in 2009 was very
close to the average score in 1990.
• Math scores rose considerably among Asian,
White, and Latino students but modestly among
African American students (see Figure 8).
• While Latino and African American students
had the same average math and reading scores
in 1990, Latino students’ scores were signifi-
cantly higher than African American students’
scores by 2009.
• The widening of the gap in reading and math
scores between White and African American
elementary grade students in Chicago was
larger than seen in national trends. On the
national NAEP exam, fourth grade racial gaps
closed substantially over the course of the three
eras in both reading and math, while eighth
grade gaps were not consistently up or down.
2
• Math and reading scores also increased more
among White and Asian students than among
Latino students.

12 Trends in Chicago’s Schools across Three Eras of Reform
• In Eras 1 and 3, schools that started off with the low-
est levels of achievement—those that most needed
to improve—were the least likely to show substantial
improvements in either reading or math. Integrated
schools, in which at least 30 percent of the students
were White or Asian, were the most likely to show
improving test scores in all eras, especially in Era 3.
High School Test Scores
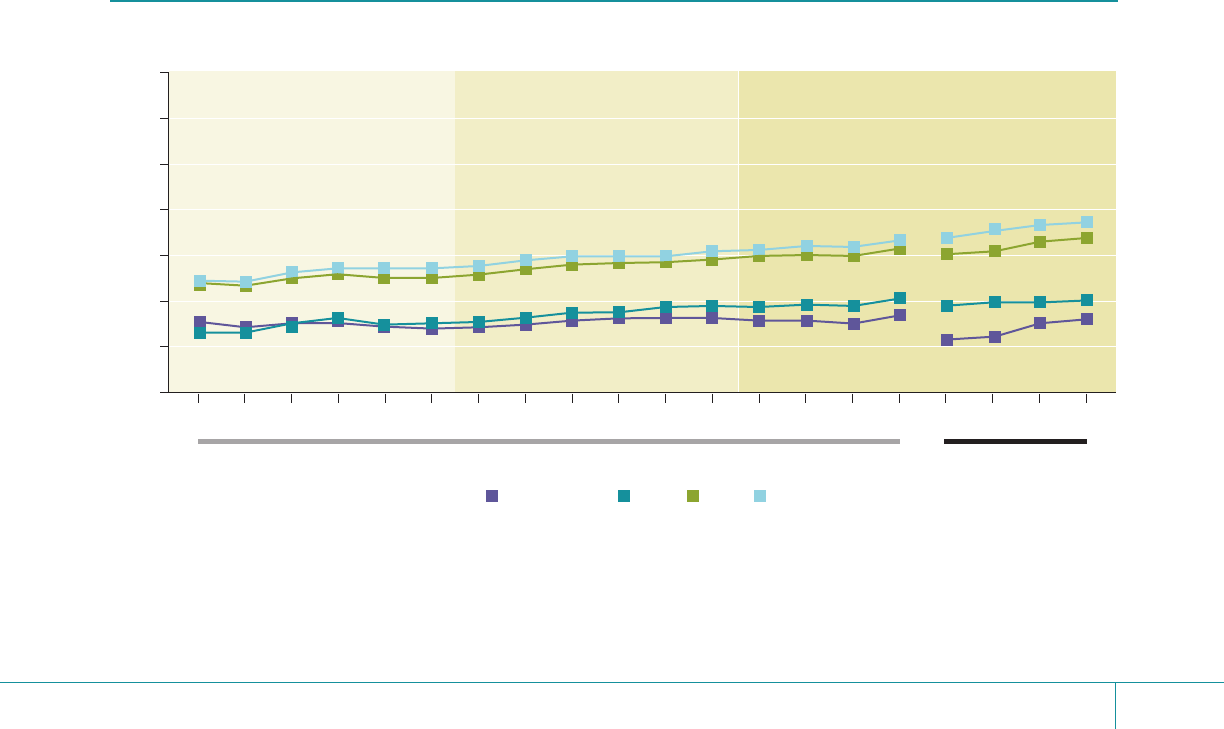
Since 2001, eleventh-graders in Illinois high schools have
been required to take the ACT as part of the Prairie State
Achievement Exam each spring. In general, ACT scores
in CPS have been improving. However, average scores
are still far below levels that would make students eligible
for admission at most four-year colleges.
During Era 3, the percentage of CPS freshmen who
took the ACT within three years of entering high school
increased considerably, from 58 percent of students
entering in fall 2000 to 69 percent of students entering
in 2006. More students were making it through the first
three years of high school to take the ACT on time;
fewer students had dropped out or failed to make
expected grade progression. At the same time, ACT
scores increased by a full point between 2001 and 2009,
from an average of 16.2 to 17.2 (see Figure 9).
Improvements in ACT scores occurred despite no im-
provements in the achievement level of students entering
CPS high schools. The EXPLORE scores from tests that
students take as they enter high school did not improve,
while the ACT scores rose (see Figure 9).
Despite this steady increase, the average score re-
mains far below college-readiness benchmarks. ACT
has established a benchmark college-readiness score
of 21 for the composite score; students scoring at this
level have a fifty-fifty chance of getting at least a B in
entry-level college classes, according to the ACT. White
and Asian students in CPS have average scores that are
about at this level, but the scores of Latino and African
American students are substantially below the bench-
mark scores. The full report provides more information
about ACT scores and college-readiness levels.
3
As with the elementary/middle school scores, high
school test scores did not improve uniformly across all
racial/ethnic groups.
Figure 8. While math test scores of all students rose, improvements were smallest among African American students
Math Scores (ISAT Units)
Math Test Scores in Elementary/Middle Grades by Racial/Ethnic Group
199219911990 1993 1994 1995 1996 1997 1998 1999 2000 2001 2002 2003 2004 2005 2006 2007 2008 2009
Era 1 Era 2 Era 3
ITBS ISAT
250
260
270
240
220
210
200
230
African American Latino White Asian
Note: The decline in scores in 2006 is a result of the change in tests and the lack of familiarity
with the new test format, as described in the full report. Trends from 2006 through 2009 could
not be adjusted for changes in ISAT scoring and exaggerate real changes in skills. See the full
report for more details.
FIG URE 8
While math test scores of all students rose, improvements were smallest among African American students

Summary of Key Findings
13
Figure 9. Eleventh grade ACT scores have been rising, even though entering ninth grade ACT scores have been flat
Mean Composite Score
2001 2002 2003 2004 2005 2006
2002 2003 2004 2005 2006
2007 2008 2009
Era 2
Students
Eras 2 and 3
Students
Era 3
Students
ACT Year (Spring)
Adjusted ACT
Unadjusted ACT
EXPLORE Year (Fall)
Unadjusted EXPLORE
18
16
17
20
19
15
13
14
16.2
16.2
16.3
16.4
16.4
16.5
16.6
16.9
16.8
17.1
16.8
17.1
17.1
17.3
17.3
17.3
17.1
17.2
14.2
14.1 14.1
14.0 14.0
Note: Adjusted ACT scores control for changes in student body composition, compared to
2001, in terms of students’ race, gender, and socio-economic level. EXPLORE is taken in
October of the ninth grade year and can be used as a measure of students’ academic skills
as they begin high school. The average EXPLORE score for the ninth grade cohort that is
displayed corresponds with on-time test-taking for the ACT year. For example, if a student
was taking the ACT on time (i.e., in their third year) in 2005, they would have taken EXPLORE
in fall 2002. The EXPLORE value then is the average ninth grade EXPLORE score for all the
students who were first-time freshmen in 2002. Similar trends are observed if we only include
the EXPLORE scores for students who made it to the end of the eleventh grade to take the
ACT, although the averages are somewhat higher.
ACT Scores and EXPLORE Scores, 2001–2009
Unadjusted ACT Adjusted ACT Unadjusted EXPLORE
FIG URE 9
Eleventh grade ACT scores have been rising, even though entering ninth grade EXPLORE scores have been flat
FIG URE 10
ACT scores improved among students of all races/ethnicities
Figure 10. ACT scores improved among students of all races/ethnicities
ACT Composite Score
ACT Scores by Student Race/Ethnicity
2001 2002 2003 2004 2005 2006 2007 2008 2009
Era 1 Era 2 Era 3
19
20
21
22
18
16
15
14
17
African American Latino White Asian
Note: ACT scores by race/ethnicity are adjusted for entering achievement, gender, and neighborhood poverty and social status.
18.7
19.4
18.8
19.4
18.9
19.5
19.0
19.7
19.2
20.0
19.1
19.9
19.5
20.2
20.0
21.0
19.8
20.7
15.0
15.6
15.1
15.7
15.2
15.7
15.4
15.8
15.6
16.1
15.6
16.1
15.9
16.2
16.0
16.6
15.9
16.5

14 Trends in Chicago’s Schools across Three Eras of Reform
• While scores grew for students of all races/ethnici-
ties, the scores of White and Asian students increased
more than those of African American or Latino
students (see Figure 10).
• Scores grew in all types of schools during Era 3,
but the largest improvements occurred in selective
enrollment high schools, and racially integrated
schools (those where at least 30 percent of students
are White or Asian).
Graduation and Dropout Rates
A sustained improvement in graduation rates and a
concurrent decline in dropout rates constitute the
most striking and positive findings of this report.
Chicago’s graduation rates increased substantially
over the course of the three eras. CPS students who
were 13 years old in the fall of 1991 were about as
likely to drop out by age 18 as they were to graduate. In
many high schools, dropout rates were higher than
graduation rates. Fourteen years later, CPS students
who were 13 years old in 2005 were more than twice
as likely to graduate by age 18 than to drop out.
Two-thirds of CPS students now obtain regular CPS
diplomas by age 19, compared with less than half of
students at the beginning of Era 1.
4
Graduation rates are usually reported for groups of
students based on the year they enter high school, and
such rates are available in the larger report. However,
these rates are problematic for examining trends over
time, as they can fluctuate with changes in grade
promotion policies (e.g., delaying when students enter
ninth grade), creation of new schools with irregular
grade structures (e.g., middle schools with grade nine),
and changes in the percentage of students who drop
out prior to ninth grade. For these reasons, we present
graduation rates by age group—following students
from age 13 until age 19. These rates are more inclu-
sive and are not affected by irregular grade progression
among students or grade structure among schools.
FIG URE 11
Graduation rates improved dramatically, especially during Era 3
Graduation and Dropout Rates for Cohorts of 13-Year-Olds Followed until Age 19
Figure 11. Graduation rates have improved dramatically, especially during Era 3
Percent of Students
Eras 1 and 2 Eras 2 and 3 Era 3
50
30
40
70
60
20
0
10
41.1
48.0
37.6
53.4
66.1
20.8
Graduation Age 18 Dropout Age 18 Graduation Age 19
Note: This figure tracks graduation and dropout rates for cohorts of students from age 13
until ages 18 and 19. Points from different lines at the same point on the horizontal axis show
outcomes for students from the same cohort, but at different ages. Graduation rates are
computed by tracking students over multiple years; therefore, they may have been 13 years
old in one era and 19 years old in another era. These statistics include students who
transferred into CPS after age 13 and incorporate them into the corresponding age cohort.
Students who left CPS through a school transfer, institutionalization, or death are not
included in the calculation of the statistics.
19921991 1993 1994 1995 1996 1997 1998 1999 2000 2001 2002 2003 2004 2005
Age 13
Fall of
Age 18
19971996 1998 1999 2000 2001 2002 2003 2004 2005 2006 2007 2008 2009 2010Fall of
Age 19
19981997 1999 2000 2001 2002 2003 2004 2005 2006 2007 2008 2009 2010Fall of

Summary of Key Findings
15
Graduation Rates by Race/Ethnicity for Male Students
Figure 12. Graduation rates improved for male students of all races/ethnicities, but remain low for boys
Percent of Students
Eras 1 and 2 Eras 2 and 3 Era 3
50
30
40
70
60
80
100
90
20
0
10
35.0
48.9
72.5
44.1
85.1
73.1
64.3
50.2
African American, Graduation Age 19 Latino, Graduation Age 19 White, Graduation Age 19 Asian, Graduation Age 19
19921991 1993 1994 1995 1996 1997 1998 1999 2000 2001 2002 2003 2004
Age 13
Fall of
Age 19
19981997 1999 2000 2001 2002 2003 2004 2005 2006 2007 2008 2009 2010Fall of
FIG URE 12
Graduation rates have improved dramatically, but remain low for boys
• Students who were 13 years old in 1991 were more
likely to drop out than to graduate by age 18, as
shown in Figure 11 (41 percent versus 38 percent).
By comparison, among students who were 13 in
2005, the last group of students with data through
age 18, 20.8 percent had dropped out by age 18 and
53.4 percent had graduated by the age of 18.
• Less than half of the 1991 cohort had graduated
by the time they were 19 in 1997. In contrast, 66
percent of the 2004 cohort of 13 year olds graduated
by the time they were 19 in 2010.
• Graduation rates for girls were substantially higher
than for boys, among students of all races/ethnicities
(see Figures 12 and 13). However, both boys and
girls showed substantial improvements in graduation
rates over the three eras.
• Graduation rates for African American students
are the lowest and grew the least of all racial/ethnic
groups. However, graduation rates still improved
considerably. Among students who were 19 years
old in 2010, half of African American boys and
nearly 70 percent of African American girls gradu-
ated. In 1997, by comparison, 35 percent of African
American boys and 53 percent of African American
girls graduated by age 19.

16 Trends in Chicago’s Schools across Three Eras of Reform
Graduation Rates by Race/Ethnicity for Female Students
Figure 13. Girls graduated at much higher rates than boys
Percent of Students
Eras 1 and 2 Eras 2 and 3 Era 3
50
30
40
70
60
80
100
90
20
0
10
52.6
63.0
79.2
55.8
89.5
82.8
75.5
69.6
African American, Graduation Age 19 Latino, Graduation Age 19 White, Graduation Age 19 Asian, Graduation Age 19
19921991 1993 1994 1995 1996 1997 1998 1999 2000 2001 2002 2003 2004
Age 13
Fall of
Age 19
19981997 1999 2000 2001 2002 2003 2004 2005 2006 2007 2008 2009 2010Fall of
FIG URE 13
Girls graduated at much higher rates than boys in all racial/ethnic groups

2
consortium on chicago school research at the university of chicago
17
Conclusion
Interpretive Summary and
Areas for Further Study
C
hicago schools are not what they were in 1990. Graduation rates have
improved tremendously, and students are more academically prepared
than they were two decades ago. ACT scores have risen in recent years, and
elementary math scores are almost a grade level above where they were in
the early 1990s. However, average elementary school test scores remain well
below levels necessary for doing college preparatory work in high school. High
schools have little chance of preparing students for college when they enter
ninth grade with extremely low skill levels. In fact, despite some improvements
in test gains in the high schools, average high school test scores remain well
below levels that indicate students are likely to succeed in college. This is not
a problem that is unique to Chicago. Nationwide, the typical high school
graduate also fails to perform at college-ready levels. Students with similar
economic and ethnic backgrounds at other schools in Illinois actually tend
to perform worse than Chicago students. However, the district has a long
way to go before the average student graduates ready to succeed in college.
Era 1, the era of decentralization when schools were given the latitude
to formulate and execute their own improvement strategies, was a baseline
period for this study. Our data sources begin to provide good information
in the middle of the era; thus, it is difficult to gauge the extent to which
students’ achievement improved under decentralization. However, there were
at least modest improvements in both elementary and high schools during
Era 1. Graduation rates were very low, but improving. And math scores rose
in the elementary grades, although they flattened in the end of the era.

18 Trends in Chicago’s Schools across Three Eras of Reform
Other research at CCSR has documented the uneven-
ness in school improvement under decentralization;
during decentralization the schools serving students
from the most economically disadvantaged commu-
nities were least likely to improve, while the schools
serving more advantaged communities were most
likely to improve.
5
These outcomes can be explained
by differences in the social resources available in
school communities. Because decentralization placed
power in the hands of elected Local School Councils,
it is not surprising that communities where residents
were active in local organizations and where schools
faced fewer social problems were more likely to show
improvements.
Era 2 was an era of strict test-based accountability
measures and bold initiatives that were enacted to trans-
form high schools (e.g., changing graduation require-
ments so that all students took a college preparatory cur-
riculum). There were large investments in infrastructure
and stability in district leadership. Test scores in the
elementary/middle grades rose during this period, and
they improved in schools serving students of all types of
backgrounds. This was the only era to show large im-
provements in the lowest-achieving schools. Prior CCSR
studies have found that the test-based accountability
policies, which held schools accountable for improve-
ments in test scores and required students to pass tests
to be promoted from certain grades, had mixed results
for students.
6
They encouraged teachers and parents to
provide more support to the lowest-achieving students,
and they encouraged better alignment of instruction to
grade-level standards. At the same time, they resulted in
a narrowing of the curriculum to focus on tested subjects
(reading and math), more instructional time spent on
test-taking practice, and a large increase in grade reten-
tion in the elementary schools. Test-based promotion
policies resulted in more students entering high school
who were old for their grade level; this had a depressing
effect on graduation rates.
7
In fact, the improvements in
graduation rates that had been occurring in Era 1 were
set back in Era 2. This dip occurred, in part, because of
the increase in grade retention and also because of the
change in graduation requirements that ended remedial
coursework and required all high school students to take
a college preparatory curriculum.
8
In Era 3, there were large improvements in outcomes
in the high schools and very little improvement in the
elementary schools. Improvements that had been oc-
curring in graduation rates accelerated, and were seen
in all types of schools, among boys and girls and all
racial/ethnic groups. At the same time, scores on the
ACT rose, even though students were not entering high
school better prepared. Students were learning more
while in high school. In the elementary grades, test
scores dropped—especially in the lowest-performing
schools. Equity declined, so that schools serving
African American students, and those that started out
the era with the lowest levels of performance, were less
likely than more advantaged schools to have improving
test scores.
While the effects of the dominant policies of Eras 1
and 2 are largely understood, much research remains
to be done to understand both the positive and prob-
lematic effects of the policies in Era 3. The decline in
equity, with African American students falling further
behind students from other racial/ethnic groups, is
particularly disturbing and has raised questions about
policies that disproportionately affected African
American students (e.g., the decision to close chroni-
cally low-performing schools and send students to other
schools). One CCSR study showed no improvements
in test scores for students who were displaced by school
closings,
9
but there is yet to be an analysis of the over-
all effect of the policies on all students and schools.
Another area requiring more study is the rise in student
performance in the high schools. Era 3 brought a much
greater use of data in the high schools to track students
and provide targeted support for passing classes and
college readiness. Further research should investigate
whether this use of data led to the improved outcomes
and, if so, exactly how it happened.
The findings in this report contradict common percep-
tions about district performance over the last two decades.
It has been widely believed that elementary schools have
improved considerably, while high schools have stagnated.
In fact, the opposite is true. These misperceptions arise
because of problems with the metrics that are used to
judge school performance, and differences in the stan-
dards by which high schools and elementary schools are
held accountable. High schools are increasingly being

Conclusion
19
judged by college-ready standards, particularly by college-
ready benchmark scores on the ACT. The benchmark
score on the ACT-aligned EXPLORE exam that students
take at the beginning of high school corresponds to much
higher skill levels than the “meets standards” benchmark
on the spring eighth grade ISAT exam. Thus, it appears
that high schools are less successful when, in fact, they
are simply held to a much higher standard. This problem
is accentuated by focusing on benchmark scores rather
than averages—few students are close to meeting the high
school benchmarks on the ACT, so it looks like there
has been little movement when there has been growth.
A further reason for misperceptions about elementary
school performance comes from non-equivalent tests,
scoring, and test administration procedures over time.
These changes have often led scores to look like they
are improving when, in fact, skill levels have remained
the same.
This report raises important questions about how
much improvement we can reasonably expect in a large
system over the span of two decades. A number of
dramatic system-wide initiatives were enacted over the
course of the three eras of school reform. But instead of
catalyzing dramatic changes in student achievement,
district-wide changes were incremental—when they
occurred at all. Meanwhile, throughout the three eras,
individual schools did manage to make substantial
improvements. Past research at CCSR suggests that
the process of school improvement involves careful
attention to building the core organizational supports
of schools—leadership, professional capacity, parent/
community involvement, school learning climate,
and instruction.
10
In fact, schools that are strong in at
least three of these five areas are 10 times more likely
to improve than schools that are weak. Building the
organizational capacity of schools takes time and is not
easily mandated at the district level. Nevertheless, the
extent to which the next era of school reform drives
system-wide improvement will likely depend on the
extent to which the next generation of reforms attends
to local context and the capacity of individual schools
throughout the district.


2
consortium on chicago school research at the university of chicago
21
Endnotes
Summary of Key Findings
1. Easton, J.Q., S. Ponisciak, and S. Luppescu (2008). From high
school to the future: The pathway to 20. Chicago: Consortium on
Chicago School Research.
2.
Analysis based on publicly available NAEP data. Department
of Education. Institute of Education Sciences. National Center
for Education Statistics (11/05/2002). “National Assessment
of Educational Progress (NAEP) Data Files.” (http://hdl.
handle.net/1902.5/609759) National Archives and Records
Administration.
3.
Also see: Roderick, M., J. Nagaoka, and E.M. Allensworth (2006).
From high school to the future: A first look at Chicago Public School
graduates’ college enrollment, college preparation, and graduation from
four-year colleges. Allensworth, E.M., M. Correa, and S. Ponisciak
(2008). From high school to the future: ACT preparation—too much,
too late.
4. Our calculations only include students who enter CPS through
regular (non-alternative) schools. Students who leave a regular
school and enter an alternative school are counted as dropouts.
Students who never enrolled in a regular CPS school are not
included in the calculations.
Conclusion
5. Bryk, A.S., P. Bender Sebring, E.M. Allensworth, S. Luppescu,
and J.Q. Easton (2010). Organizing schools for improvement:
Lessons from Chicago. Chicago: University of Chicago Press.
6.
Roderick, M., and J. Nagaoka (2005). Retention under Chicago’s
high-stakes testing program: Helpful, harmful, or harmless?
Education Evaluation and Policy Analysis, 24(4), 309–40;
Allensworth, E.M., and J. Nagaoka (2010). “The effects of
retaining students in grade with high stakes promotion tests.”
Chapter 20 in J. Meece (ed.), Handbook on Schools, Schooling,
and Human Development, Taylor and Francis.
7.
Allensworth, E.M. (2005). Dropout rates after high-stakes testing
in elementary school: A study of the contradictory effects of
Chicago’s efforts to end social promotion. Educational Evaluation
and Policy Analysis, 27(4).
8.
Montgomery, N., and E.M. Allensworth (2010). Passing through
science: The effects of raising graduation requirements in science
on course-taking and academic achievement in Chicago. Chicago:
Consortium on Chicago School Research.
9.
De la Torre, M., and J. Gwynne (2009). When schools close:
Effects on displaced students in Chicago Public Schools. Chicago:
Consortium on Chicago School Research.
10. Bryk, A.S., P. Bender Sebring, E.M. Allensworth, S. Luppescu,
and J.Q. Easton (2010). Organizing schools for improvement:
Lessons from Chicago. Chicago: University of Chicago Press.

About the Authors
Stuart Luppescu
Stuart Luppescu is CCSR’s Chief Psychometrician, specializing in educational measurement. He received B.A.
and M.A. degrees in Linguistics from Cornell, an M.A. in English as a Second Language from the University of
Hawaii, and a Ph.D. in Educational Measurement from the University of Chicago. Before coming to Chicago,
Mr. Luppescu taught English in Japan and Hawaii for 13 years. His research interests are in language acquisition,
Rasch Measurement, and multi-level modeling of achievement data.
Elaine M. Allensworth
Elaine Allensworth, Ph.D., is Senior Director and Chief Research Officer at the Consortium on Chicago School
Research at the University of Chicago. She is best known for her research on early indicators of high school
graduation, college readiness, and the transition from middle to high school. Her work on early indicators of
high school graduation has been adopted for tracking systems used in Chicago and other districts across the
country, and is the basis for a tool developed by the National High School Center. She is one of the authors of the
book Organizing Schools for Improvement: Lessons from Chicago, which provides a detailed analysis of school
practices and community conditions that promote school improvement. Currently, she is working on several studies
of high school curriculum funded by the Institute of Education Sciences at the U.S. Department of Education
and the National Science Foundation. She recently began a study of middle grade predictors of college readiness,
funded by the Bill and Melinda Gates Foundation. Dr. Allensworth holds a Ph.D. in Sociology, an M.A. in Urban
Studies from Michigan State University, and was once a high school Spanish and science teacher.
Paul Moore
Paul Moore is a research analyst at CCSR and is in the process of completing an M.A. in the Social Sciences
at the University of Chicago. His research interests include quantitative modeling and methodology, and he is
currently working on a study of middle grade predictors of college readiness funded by the Bill and Melinda Gates
Foundation. Paul earned a B.S. in Mathematics and Education from Vanderbilt University.
Marisa de la Torre
Marisa de la Torre is Associate Director for Professional Development at CCSR. Her work involves studying
different Chicago Public Schools’ policies, including high school choice and school closings. Her work on high
school choice in Chicago was recently published in School Choice and School Improvement. Currently, she is
studying a number of different reforms aimed at low-performing schools and indicators of high school readiness.
Before joining CCSR, she worked for the Chicago Public Schools in the Office of Research, Evaluation, and
Accountability. She received a master’s degree in Economics from Northwestern University.
James Murphy
James Murphy is a research analyst at the Consortium on Chicago School Research. He received his B.A. in
Sociology from the University of Chicago. He previously worked as an education policy analyst for the New York
City Independent Budget Office.
This report reflects the interpretation of the authors. Although CCSR’s Steering Committee provided
technical advice and reviewed earlier versions, no formal endorsement by these individuals, organizations, or the full
Consortium should be assumed.
This report was produced by CCSR’s publications and communications staff.
Editing by Ann Lindner
Graphic Design by Jeff Hall Design
Photos by David Schalliol
9-11/.5M/jh.design

T
he Consortium on Chicago School Research (CCSR) at the University of Chicago conducts research
of high technical quality that can inform and assess policy and practice in the Chicago Public Schools.
We seek to expand communication among researchers, policymakers, and practitioners as we support the
search for solutions to the problems of school reform. CCSR encourages the use of research in policy action and
improvement of practice, but does not argue for particular policies or programs. Rather, we help to build capac-
ity for school reform by identifying what matters for student success and school improvement, creating critical
indicators to chart progress, and conducting theory-driven evaluation to identify how programs and policies
are working.
Our Mission
Consortium on Chicago School Research
Steering Committee
Ruanda Garth McCullough,
Co-Chair
Loyola University, Chicago
Arie J. van der Ploeg,
Co-Chair
American Institutes
for Research
Institutional Members
Clarice Berry
Chicago Principals and
Administrators Association
Karen Lewis
Chicago Teachers Union
Individual Members
Veronica Anderson
Stanford University
Amie Greer
Vaughn Occupational
High School-CPS
Cornelia Grumman
Ounce of Prevention
Timothy Knowles
Urban Education Institute
Dennis Lacewell
Urban Prep Charter Academy
for Young Men
Lila Leff
Umoja Student Development
Corporation
Peter Martinez
University of Illinois
at Chicago
Gregory Michie
Concordia University
of Chicago
Brian Spittle
DePaul University
Matthew Stagner
Chapin Hall
Center for Children
Luis R. Soria
Ellen Mitchell
Elementary School
Kathleen St. Louis
The Chicago Public
Education Fund
Amy Treadwell
Teach Plus Chicago
Josie Yanguas
Illinois Resource Center
Kim Zalent
Business and
Professional People
for the Public Interest
Steve Zemelman
Illinois Writing Project
Directors
Paul D. Goren
Lewis-Sebring Director
Consortium on Chicago
School Research
Elaine M. Allensworth
Senior Director and
Chief Research Officer
Consortium on Chicago
School Research
Melissa Roderick
Hermon Dunlap Smith
Professor
School of Social Service
Administration
University of Chicago
Penny Bender Sebring
Founding Director
Consortium on Chicago
School Research

24 Trends in Chicago’s Schools across Three Eras of Reform
ccsr.uchicago.edu
1313 East 60th Street Chicago, Illinois 60637 T 773-702-3364 F 773-702-2010
c c s r
CONSORTIUM ON
CHICAGO SCHOOL RESEARCH
AT THE UNIVERSITY OF CHICAGO
URBAN EDUCATION INSTITUTE
